This paper discusses the author's computer modeling of a complete Tesla coil system. The model is presented along with the predicted voltage and current waveforms. The predicted results are compared to actual measurements in a real Tesla coil for comparison.
Introduction:
This paper will demonstrate that the voltages and currents in a Tesla coil system can be accurately predicted with computer modeling tools. The author uses high-bandwidth fiber-optic voltage and current probes and voltage-sensing plane-wave antenna arrays to analyze and verify the model's predicted waveforms.
It is important to state that neither the computer model nor the actual measured results would have much meaning by themselves. The computer model could never attain high accuracy without actual measurements to verify and measure the needed parameters. Likewise, the actual measurements, while fascinating, are not very useful unless their meaning can be analyzed and understood with the help of a computer's immense power.
The Tesla Coil System:
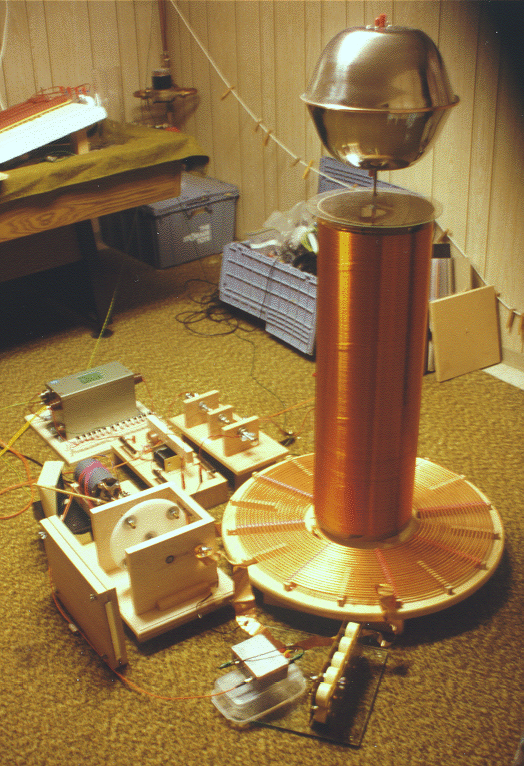
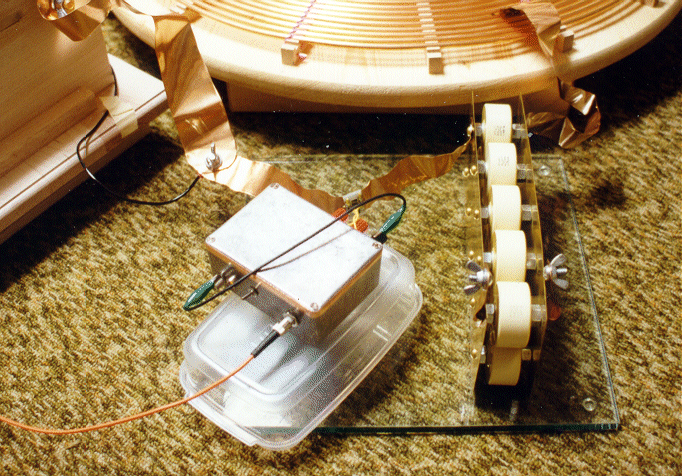
The Tesla coil that is studied here is the author's research coil system. This system has been studied for over a year and its behavior and parameters are well known. Below are pictures of the system.
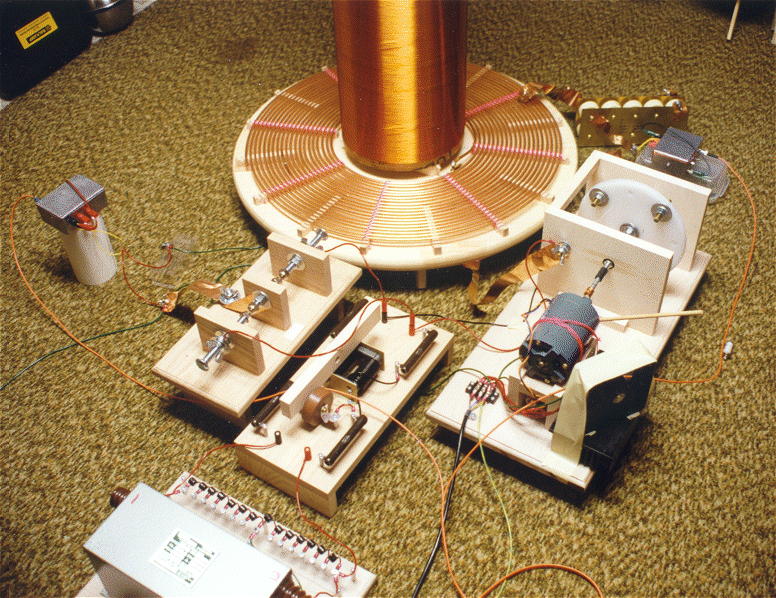
Two views of the author's Tesla coil.
For this paper, the coil was operated
with 60 volts ac input to the transformer. This allowed the measurements
to be easily made. At higher power, the arcs would strike the ceiling and
other objects in the room.
Specifications for the Tesla Coil
Charging system:
Variac 10 amp 0 - 140 Vac.
Neon sign transformer Transco 15kV 60mA.
Typical line filters and switching circuits.
Filter System (in order):
14 1800 volt MOVs
Two 5k ohm 50W Ohmite power resistors.
One 2700 pF 30kV doorknob capacitor.
Common mode choke.
Two more 5k ohm 50W Ohmite power resistors.
11.3kV spark gaps on each leg.
Spark Gap:
1800 RPM synchronous (phase fully adjustable).
Four 3/8 inch all-thread brass electrodes spinning on a 7 disk.
120 BPS
Primary Capacitor:
17.05nF. Composed of ten 1.7nF 30kV HF doorknob capacitors.
Primary Inductor:
Inductance 127.9uH.
1/4 inch copper tubing.
12 inch inner diameter.
1/8 inch space between turns.
Tapped at 15.1 turns.
Primary system resistance:
~3 ohms
Secondary Inductor:
Inductance 75.4mH.
#24 enameled copper wire.
10.25 inch diameter.
30.0 inches long.
1000 turns (space wound).
Q = 160
Adjustable height (1 inch in this case).
DC Resistance 68.87 ohms.
Self Capacitance 16.68pF.
Top Terminal:
Two 12 inch salad bowls taped together with copper tape.
Adds 10.25pF to system.
General:
Primary Resonant Frequency 107.8kHz
Secondary Resonant Frequency 111.7kHz
Primary to Secondary Coupling K = 0.1753
The Measurement System:
The voltages and currents are measured with various voltage and current transducers. These are connected to fiber-optic transmitters which convert the voltage levels from the transducers into a proportional light signal that is sent through a 10 meter length of dual fiber-optic cable. This system allows for total isolation of the measurement devices. The bandwidth of the system can go as high as 40MHz if needed. A plane-wave antenna system is used to measure secondary voltage from the coil. These measurement systems have been previously discussed in other papers.
500-Amp Current sensor used to measure
primary current.
The transducers available for this system are as follows:
-500 to 500 mA Current (10 ohm)
-5 to 5 A Current (1 ohm)
-50 to 50 A Current (0.1 ohm)
-500 to 500A Current (0.01 ohm)
-500 to 500 V Voltage (50K ohm)
-50000 to 50000 V Voltage (5M ohm)
The top terminal also has a 50 amp current transducer in the base and a 5 amp transducer connected to a top terminal. These allow the measurement of the input current to the terminal and the current to the arc streamer.
All of the transducers have a bandwidth
of 2.5MHz which can be extended to 40MHz with reduced accuracy. The plane-wave
antenna arrays have a bandwidth of 100MHz. All the signals are feed to
a Tektronix TDS 210 digital storage oscilloscope. There is an inkjet printer
and a laptop PC typically connected to the oscilloscope to record the captured
waveforms.
Tesla Coil Computer Model:
Below is a spice schematic diagram of the model used to predict the Tesla coil system's behavior.
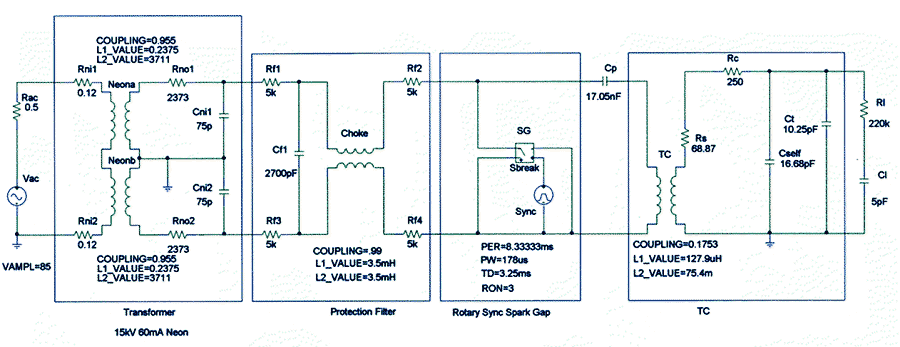
This model uses MicroSim. However, any spice circuit simulation program should be capable of running the same model with the same results.
The values for the neon transformer's parameters where found by measurement and calculation using standard techniques. The values of the protection circuit components are simply the component values. The synchronous spark gap's values need to be measured. The pulse width (PW) is found by measuring the duration of the gap's conduction. This can be estimated without measurement by estimating at which notch quenching will occur. The time delay can be calculated but it is time consuming to find the maximum voltage point. The resistance is found be measuring the ring down time of just the primary circuit and adjusting the resistance in the model to match the actual system. The values of the Tesla coil components can be found by conventional methods. The corona loss (Rc) is found by measuring the no-breakout ringdown time in a similar way as the primary circuit resistance was found. The streamer load is estimated as a 220k ohm resistance in series with a capacitor of value 1pF for every foot of streamer length. Surprisingly, this rule seems to hold true for small coils as well as very large coils systems.
This basic model has been used by the author for some time. Recently, only minor adjustments have been made to it. With experience, it is felt that one can accurately predict a new coil system before it is constructed. Only the primary circuit resistance and the total capacitance of the secondary system are difficult to know accurately before the system is built. However, these are not major drawbacks to designing a system.
The Tesla coil system presented was
both modeled and measured. The results are now presented. The first waveforms
are screen captures from the computer model. The second waveforms are captured
from the digital oscilloscope.
Modeled and Actual Waveforms:
AC Input Voltage and Current
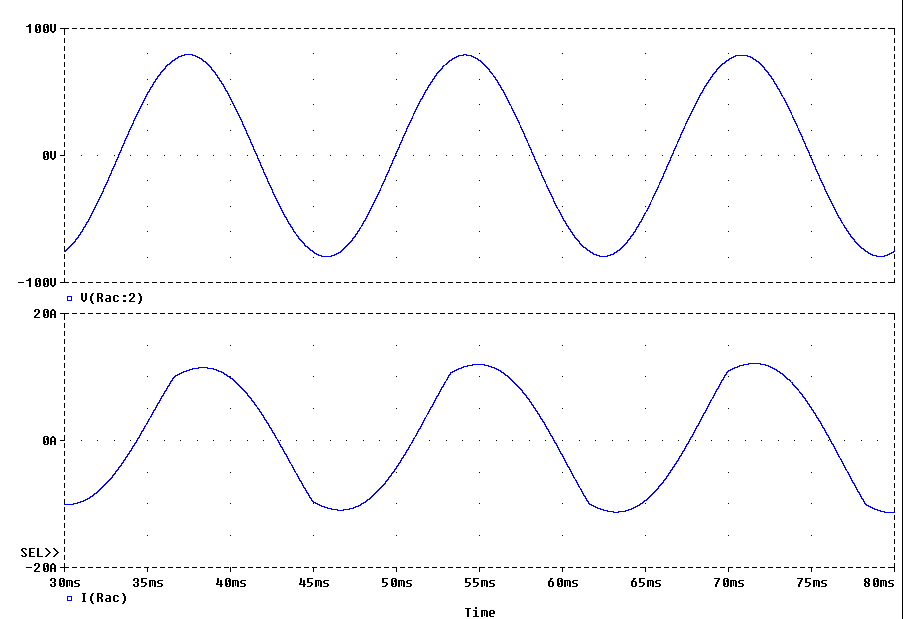
Modeled Voltage (top) and Current (bottom)
Measured Voltage (top - 100V/div) and Current (bottom - 10A/div) t= 5mS/div
The input AC waveforms are as expected.
The phase and firing timing of the actual waveform seems to match the computer
model very well. The computer model accurately predicted the flattened
peaks on the current waveform. It was noted that there appear to be significant
voltage spikes on the primary of the neon transformer. There appear to
be consistent positive spikes in the current waveform which indicates that
these spikes may be formed by very high frequency noise. The appearance
of these spikes may indicate that there is a problem with the grounding.
Neon Transformer Output Voltage and current
Modeled Voltage (top) and Current (bottom)
Measured Voltage (top - 20000V/div) and Current (bottom - 100mA/div)
t= 5mS/div
The shape and phase of the actual and
predicted waveforms matches well. The amplitude of the transformer output
current seems low. This may be due to a poor fiber-optic coupling. The
large current spikes in the current waveform appear to be real and significant.
The model suggests that these spikes should be only 10% of the measured
amplitudes. Perhaps there is a problem with the "floating" filter configuration
used in this system. This problem will need further study.
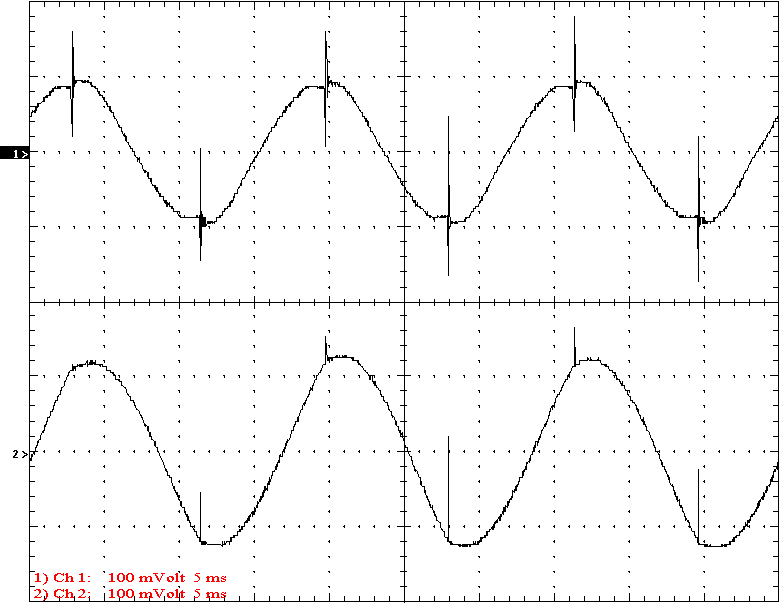
Protection Filter Output Voltage and Current
Modeled Voltage (top) and Current (bottom)
Measured Voltage (top - 20000V/div) and Current (bottom - 100mA/div)
t= 5mS/div
Given that the predicted and actual current waveforms were the opposite polarity (transducer backwards), these waveforms match very well. Apparently, the amplitudes of the signals were lower than they should have been. It appears the gap may have been firing a little too soon which may have caused this.
Protection Filter Output Voltage and Current
Modeled Voltage (top) and Current (bottom)
Measured Voltage (top - 20000V/div) and Current (bottom - 500mA/div)
t= 5mS/div
Noise spikes are very difficult to
model. However, the spikes on the output of the filter network should be
easier than most to predict. In this case, the model predicted the spikes
very well. The voltage waveform shows spikes that were not predicted by
the model. This could have been from radiated noise which is a significant
effect but not accounted for by the computer model.
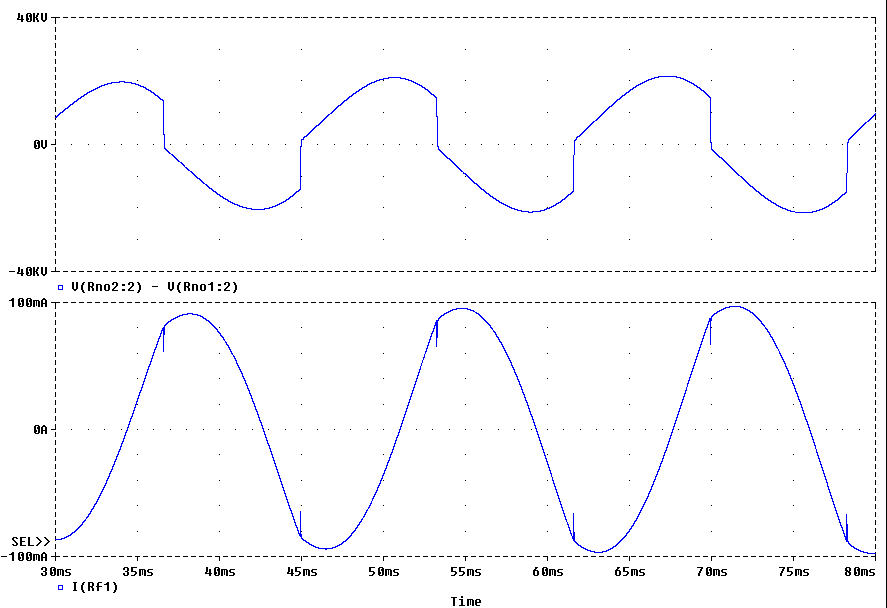
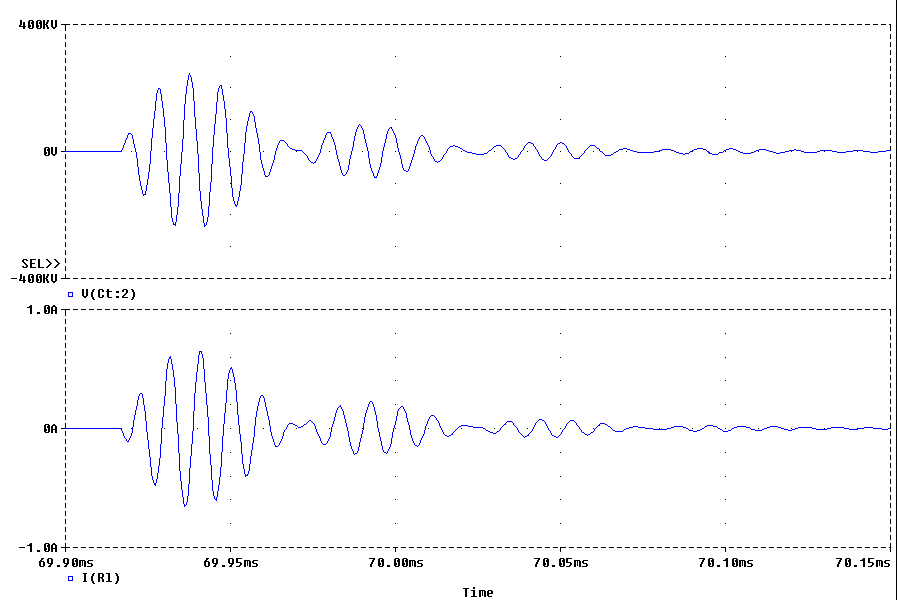
Primary Circuit Voltage and Current
Modeled Voltage (top) and Current (bottom)
Measured Voltage (top - 20000V/div) and Current (bottom - 100A/div) t= 5mS/div
The primary voltage and current waveforms are key to the operation of a Tesla coil system. In this case, the actual and predicted waveforms are extremely similar to each other.
It should be noted that this system
does not fire at the peak of the voltage waveform. If the gap were to fire
sooner, the total voltage would decrease and power would be lost. This
is due to the resonant nature of the primary circuit. The computer model
can predict and suggest optimal component values to take advantage of this
phenomena. In this case, a 24.5nF primary capacitor value would be optimal
as predicted by the computer model. This complex subject will be the subject
of a future paper.
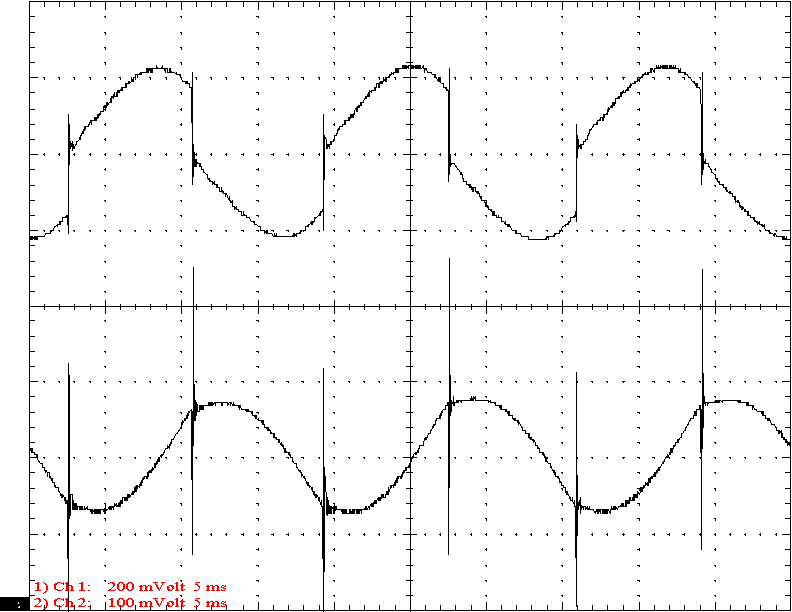
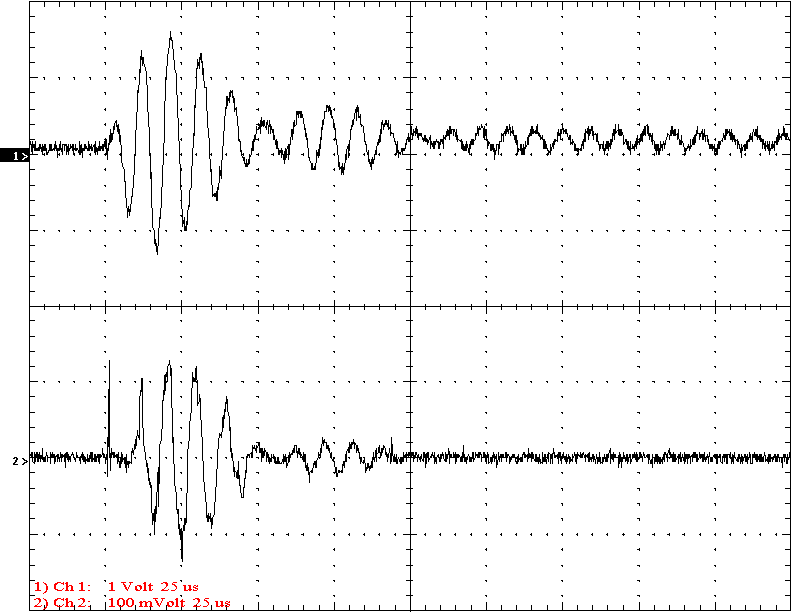
Primary Circuit Voltage and Current
Modeled Voltage (top) and Current (bottom)
Measured Voltage (top - 20000V/div) and Current (bottom - 100A/div)
t= 25uS/div
The actual and predicted primary current waveforms are almost exactly the same. The primary current pulse is not predicted by the model. However, the parasitic elements that cause this spike have been studied and adding them would not be difficult.
The voltage across the primary capacitor
shows some distortion from radiated noise. Also, the beginning of the event
is somewhat different that predicted. This is probably due to the dynamics
of the actual gap. The model assumes the gap turns on as a perfect switch
which may not be accurate. The real voltage waveform has a DC offset which
is not uncommon in the real system. Again, this is caused by the real gap
dynamics.
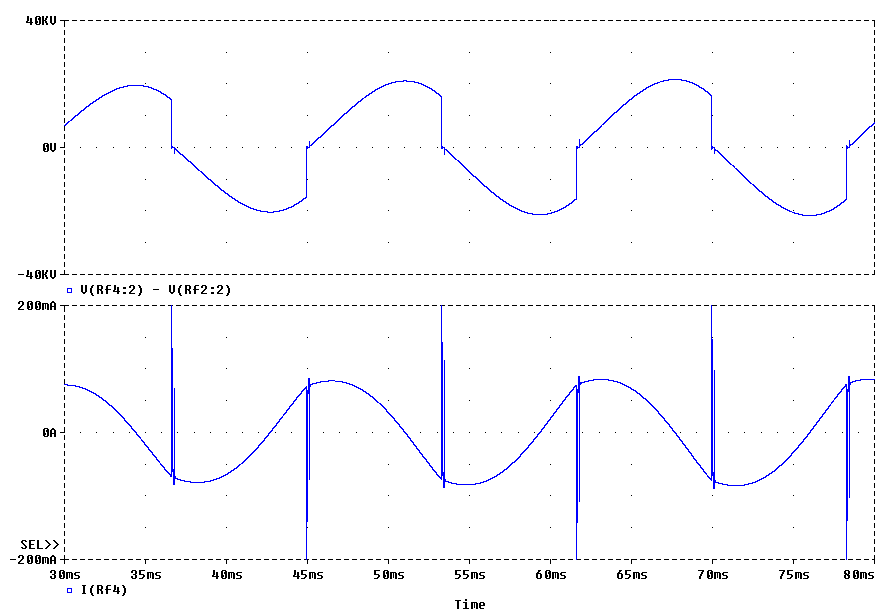
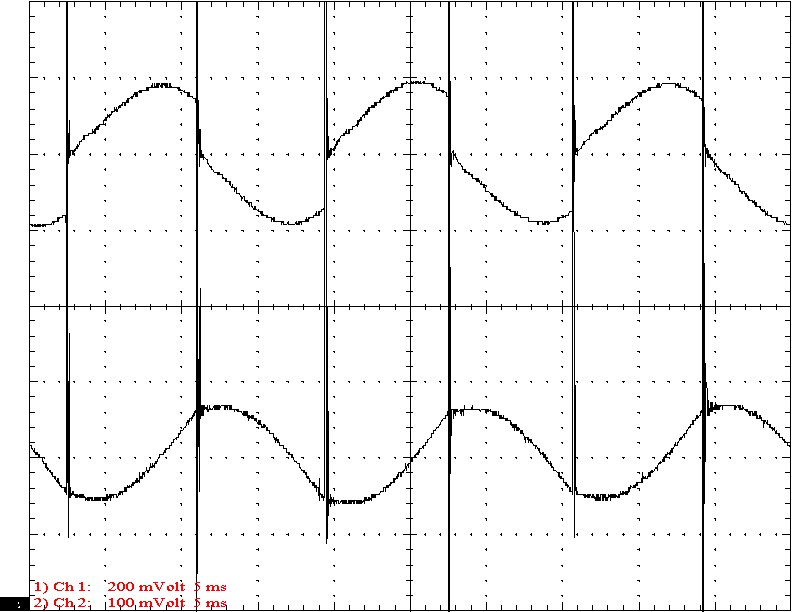
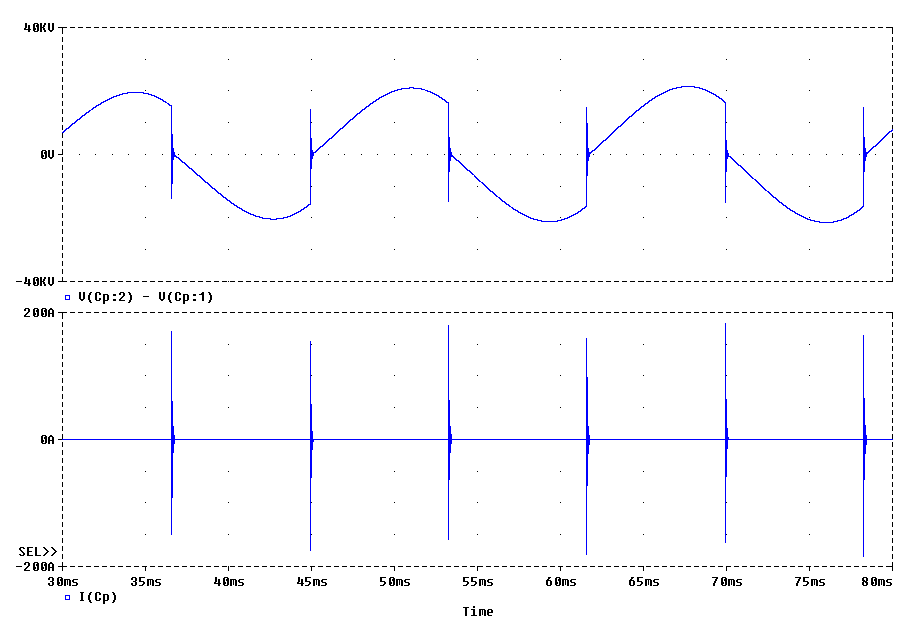
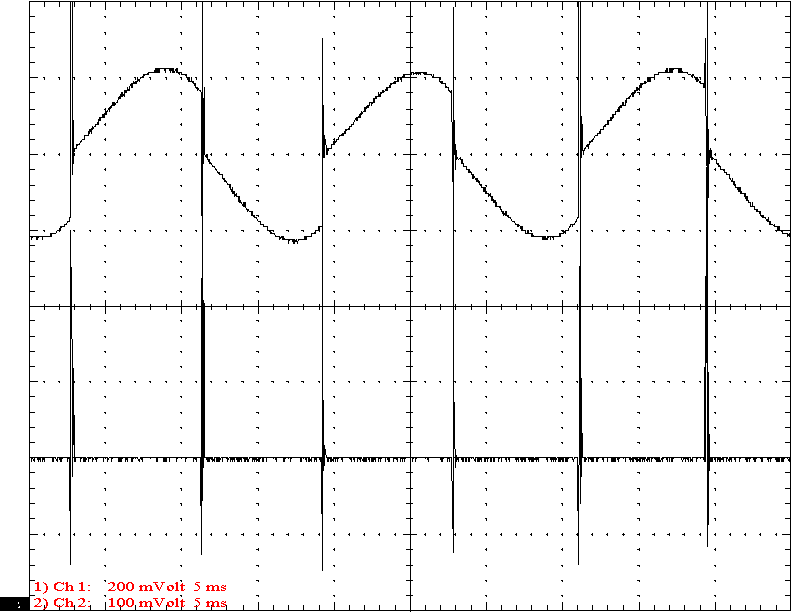
Top Terminal Voltage and Secondary Base Current
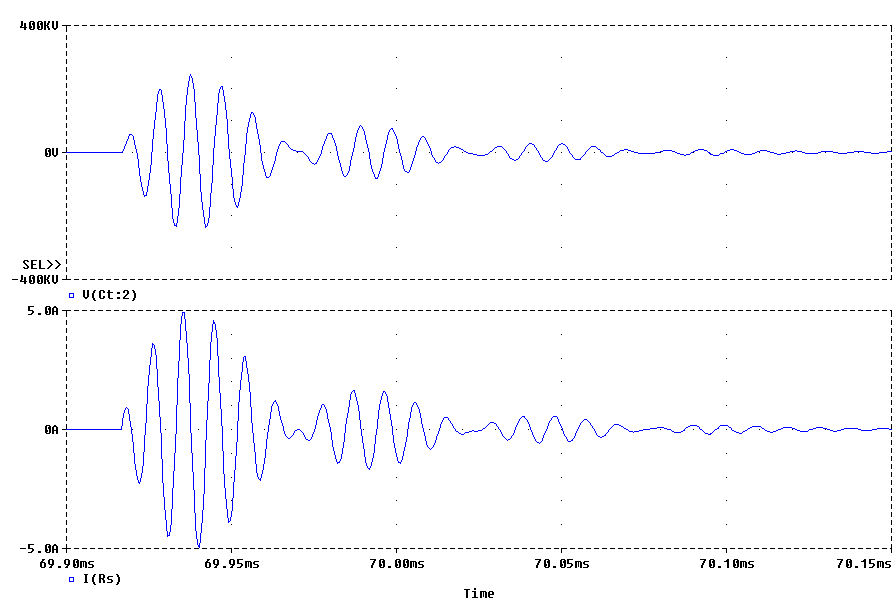
Modeled Voltage (top) and Current (bottom)
Measured Voltage (top - 200kV/div) and Current (bottom - 2A/div) t= 25uS/div
The top actual trace here is the first to demonstrate the signals obtained from the plane-wave antenna. The accuracy of these waveforms is remarkable considering that the system was delivering 1.5 to 2 foot long streamers. This not only demonstrates that the model can predict Tesla coil behavior with streamers but that streamer loading is not a great challenge to the computer model. The discovery of a simple model of streamer loading (220k plus ~1pF per foot of arc) is a very important breakthrough.
The 1pF value may be rather low as
indicated by the authors testing. A value of 1.5 to 2 pF per foot of arc
may be more accurate. Of course, the function may be slightly non-linear
as well. Future testing will clarify this.
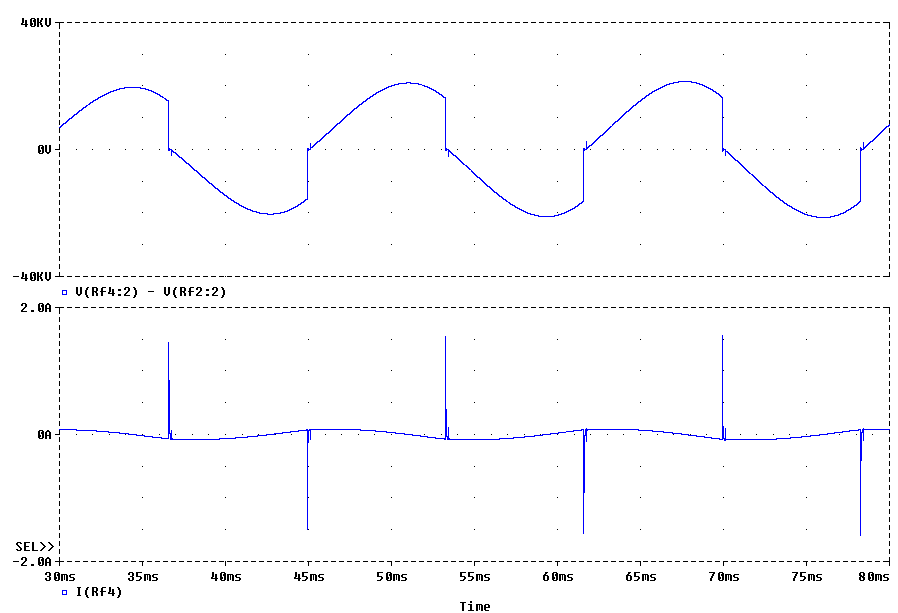
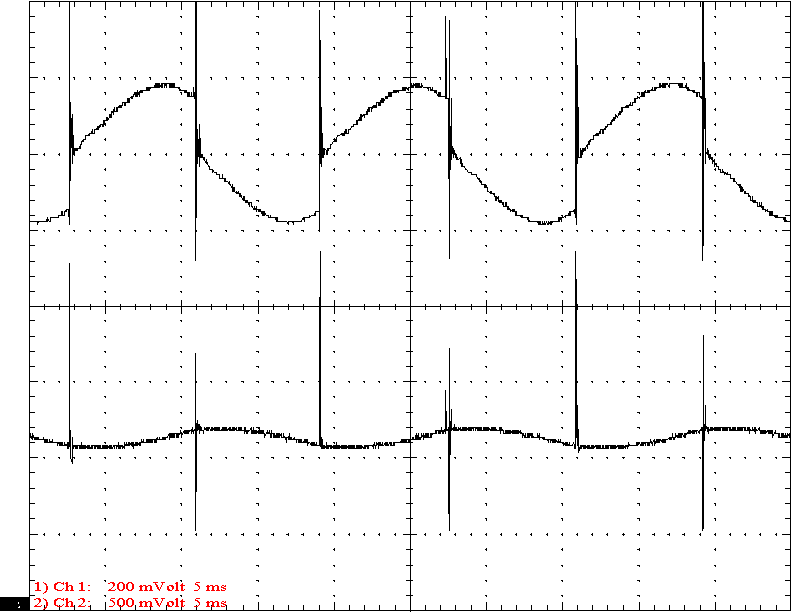
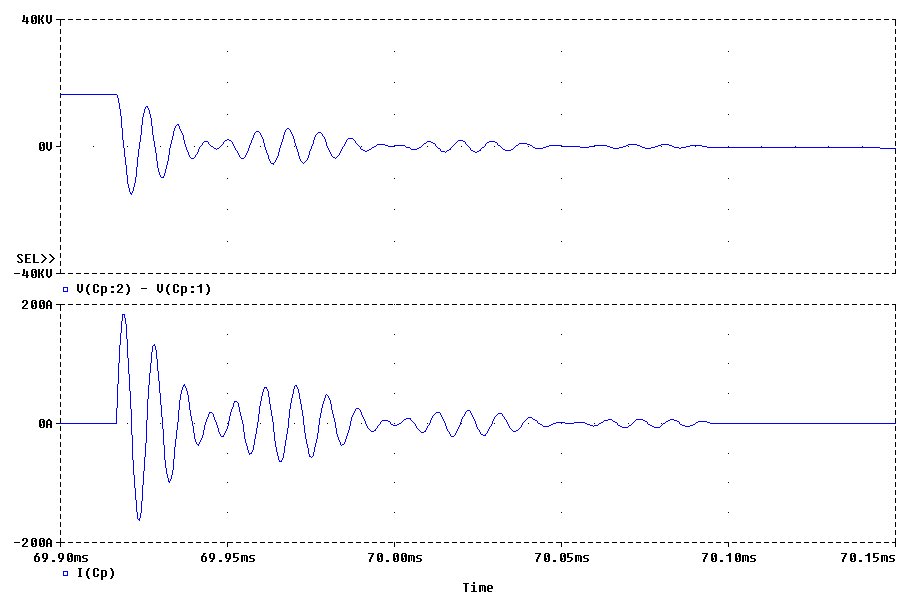
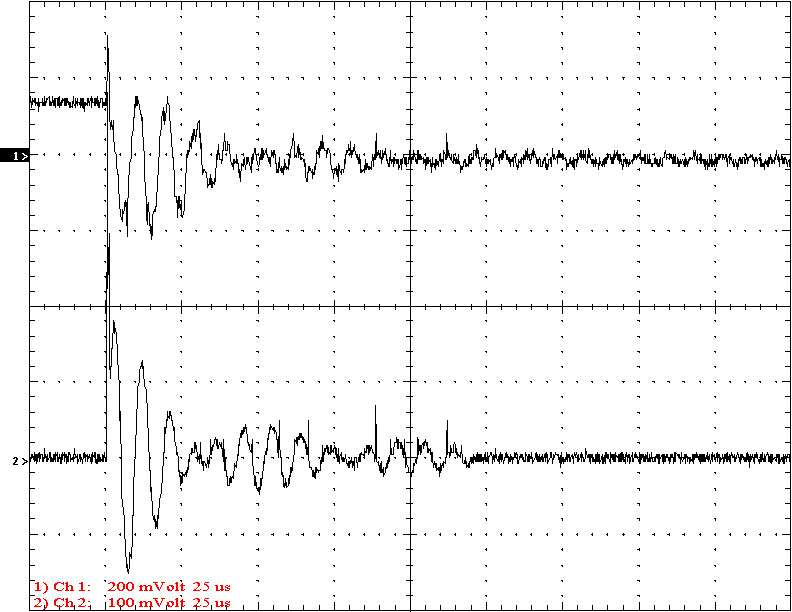
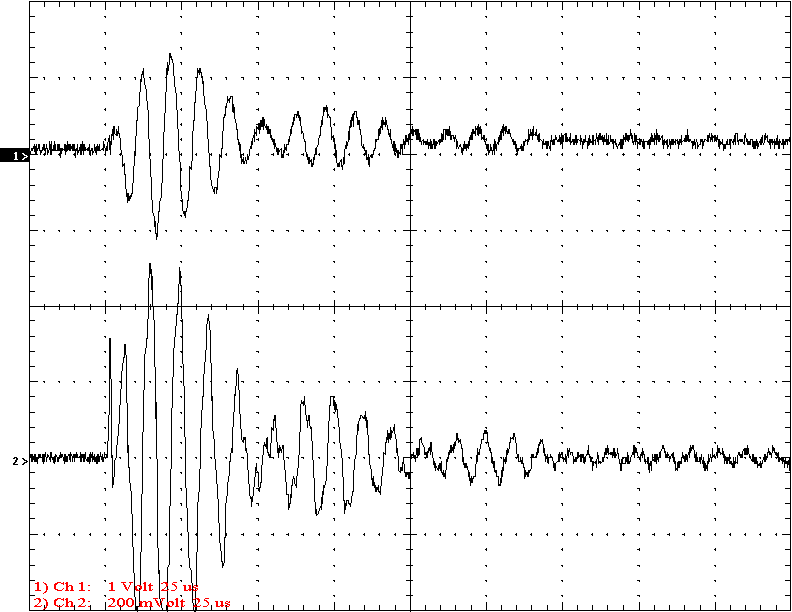
Top Terminal Voltage and Current to the Arc
Modeled Voltage (top) and Current (bottom)
Measured Voltage (top - 200kV/div) and Current (bottom - 1A/div) t= 25uS/div
The output voltage waveforms match remarkably well. The real waveform shows that the coil quenched earlier than the model shows but this varies much from arc to arc.
The current to the arc waveform shows sharper points and more distortion than predicted due to arc leaders and the variability of the arc. However, the waveform is generally accurate. The current to the arc seems higher than predicted. This may be due to the arc nearing the ceiling or the model for the arc needs some adjustment. No doubt, the model for the streamer could be improved. However, even this early attempt gives very good results.
Conclusion:
This paper demonstrates that computer modeling can give very accurate predictions of Tesla coil behavior. The amplitudes and shapes of the signals predicted by the computer model match actual waveforms very well.
There is considerable noise in Tesla coil circuits that may affect actual measurements. There seemed to be a real noise problem in the neon transformer's signals that modeling did not predict. However, this may have been due to a circuit problem with the Tesla coil used here.
The experience gained in this type of testing should make design of Tesla coils much easier. Indeed, the models can very accurately predict and optimize the complex interactions of the primary circuit resonances with remarkable accuracy.
The streamer loading on the Tesla coil was accurately predicted by this model. The model of streamer loading is very new and simplistic but it still gives very good results even at this early stage.