 |
Christophe BASSO, consultant, SINARD, FRANCESpark gaps or Electrical Surge Arrestors (ESAs) are highly nonlinear devices whose function is to stop transient surges on DC or AC power-supply lines. Such transients can be caused by lightning strikes, motor starts, etc. In other cases, spark gaps can also be used repetitively in ignition-type circuits. A spark gap is made of two electrodes that face each other across a short distance. The gap is fill with air or an inert gas like argon or neon. If the voltage applied to the ESA is below its striking voltage (or avalanche potential), the current flowing through the ESA is close to zero. Once the striking voltage is attained, the voltage across the ESA suddenly collapses to a value called the glow voltage. If the current still increases, the ESA voltage decreases further to a level called the arc voltage, where it stays until the surge passes. At this point, the ESA stays conductive until its current falls below a sustaining value in a manner similar to a thyristor.
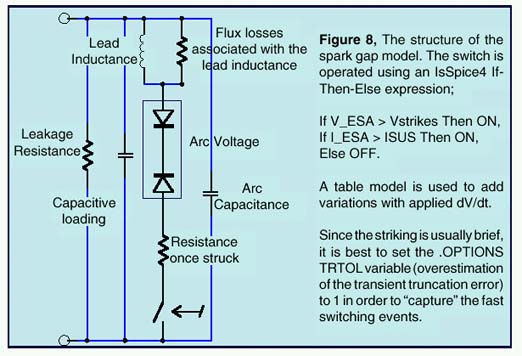
Modeling such a component with SPICE can be done in several ways [1, 2]. For the sake of efficiency, we have used a macro-modeling technique. It consists of assembling SPICE primitives in a group to describe a complex electrical function. Figure 8 depicts the general ESA model we have adopted.
|
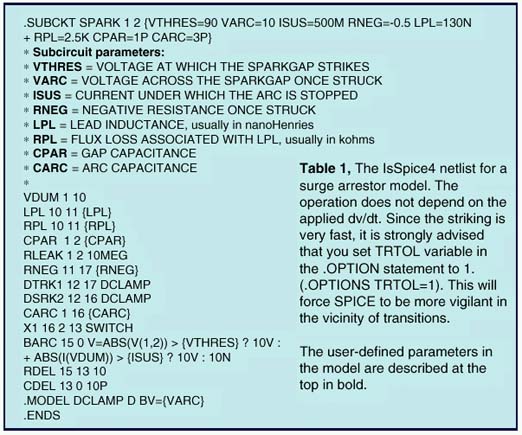
In the OFF state, the voltage-controlled switch is open and only a leakage current circulates in the ESA. The switch stays OFF until the voltage across the ESA rises up to the striking voltage. At this point, the switch is immediately driven ON and the network made of the back-to-back zener diodes and the series resistance is applied across the ESA terminals. At this point, the voltage collapses to the arc value and the current starts to rise. When the surge passes, the ESA current decays until the sustaining value is reached and the switch opens. In the first model in Table 1, the glow transition is not taken into account, and neither is the dV/dt applied to the ESA. The netlist uses standard SPICE3 elements combined with an IsSpice4 If-Then-Else behavioral element (BARC, in Table 1 below) which performs the arcing action.
 |
In the second model, shown in Table 2, a behavioral piecewise linear (PWL) table function is used to account for the dV/dt applied to the device. The PWL table converts the absolute value of the applied slope in coefficients that, when multiplied by VTHRES, will increase the final BARC level. The PWL values in the PWL_001 model are extracted from a curve which depicts the ignition voltage versus the applied dV/dt. The curve generally appears parabolic when the x axis uses a log scaling. The effect is modeled by the source BARC 15 0 V=ABS(V(1,2)) > {VTHRES} + {VTHRES} * V(33) ?... V(33) increases VTHRES by a ratio defined by the manufacturers curves.
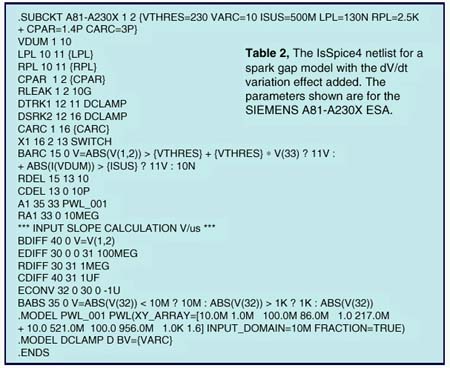 |
Obtaining the PWL points is easy. For the Siemens A81-A230x, the threshold voltage of the spark gap is 230V. The curve is flat up to 10kV/s or 10mV/us. For shallow slopes, up to 10mV/us, the first coefficient will be very low, between 1mV and zero. The third point on the curve is for 10E6V/s or 1V/us. At this point, the threshold voltage is 280V. The coefficient is simply: ABS(230-280)/230=0.217, or in the PWL table format: 1.0, 217M. For 10E7V/s or 10V/us, the curve gives a threshold of 350V: ABS(230-350/230)=521M > 10, 521M and so on. To adapt the model to a particular spark gap device, you only need to enter a few parameters (variables in curly braces) found in the manufacturers technical specifications.
 |
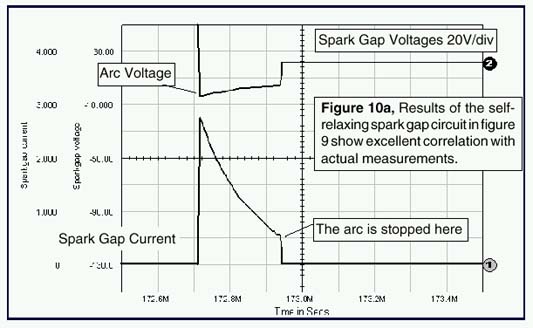 |
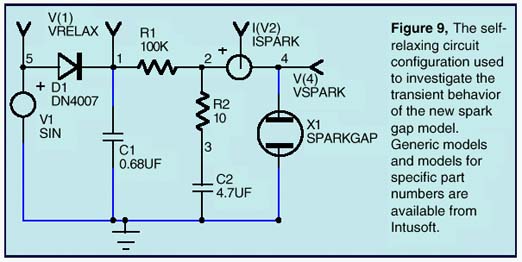
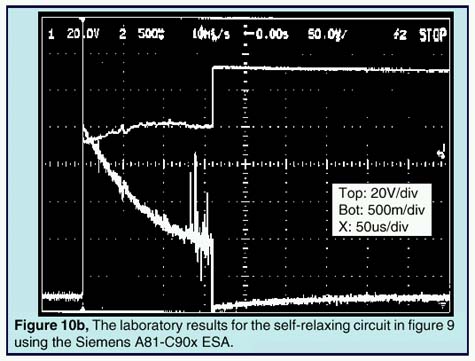
The first IsSpice4 test is made using a self-relaxing configura-tion as depicted by Figure 9. Since the phenomena are very fast, you will need to view the raw non-interpolated SPICE data (internal calculated data points) simulated by IsSpice4 and not the interpolated (.PRINT) data specified by the TSTEP parameter in the .TRAN statement. Thanks to IntuScope, ICAPs waveform analysis tool, you can easily explore both types of data. Figure 10a depicts the results given by IsSpice4. Figure 10b shows an oscilloscope hard-copy of the actual tested circuit.
 |
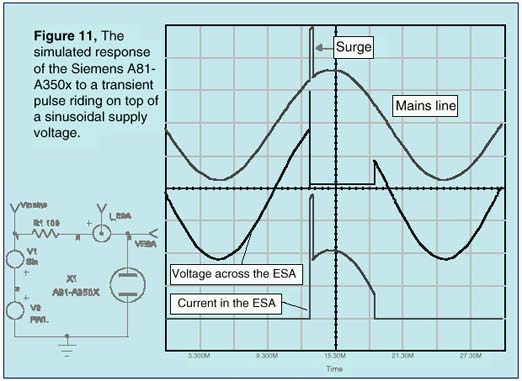
A second test is run using the spark gap as a real surge arrestor. The power mains supply a device protected by an ESA. A 1ms transient (PWL source: PWL 0 0 13ms 0 13.001m 600 13.3ms 600 13.301m 0) has been added to the sinusoidal (SIN 0 320 50) supply voltage in order to trigger the ESA. The results simulated by IsSpice4 are shown on Figure 11.
 |
The model presented here runs fast and converges without difficulties. Although the model accounts for several nonlinear effects, it is still a simplification of the complex phenomenon associated with spark gap ignition and arcing.
A pre-made set of surge arrestor models for various manufacturers devices is available as part of the new Mechatronics model library. The library will be available November 3, 1997. More details on the Mechatronics library will be available in the next newsletter.
References
[1] An Electrical Surge Arrestor (ESA) Model For Electromagnetic Pulse Analysis, Rockwell International Electronics Operations, IEEE Transactions on Nuclear Science, Vol. NS-24, No 6, December 1977
[2] A SPICE model for simulating Arc Discharge load, M. NARUI, 1991 IEEE Industry Applications Society Annual Meeting, Volume II.