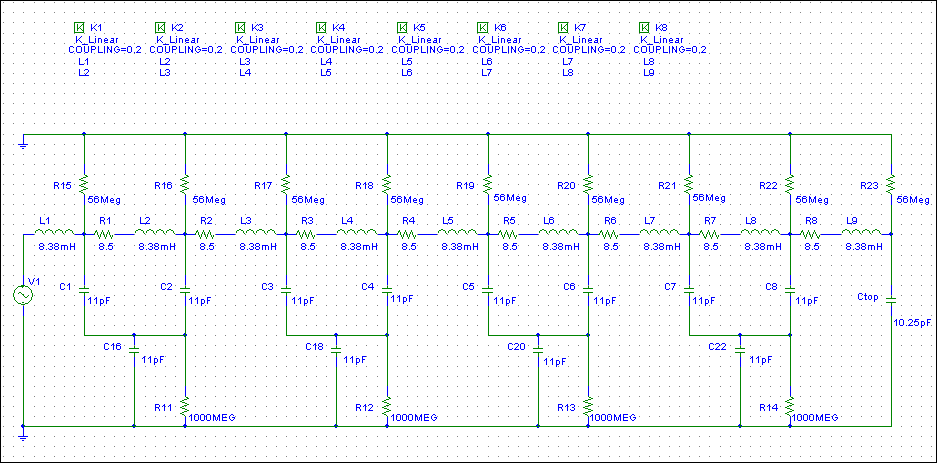

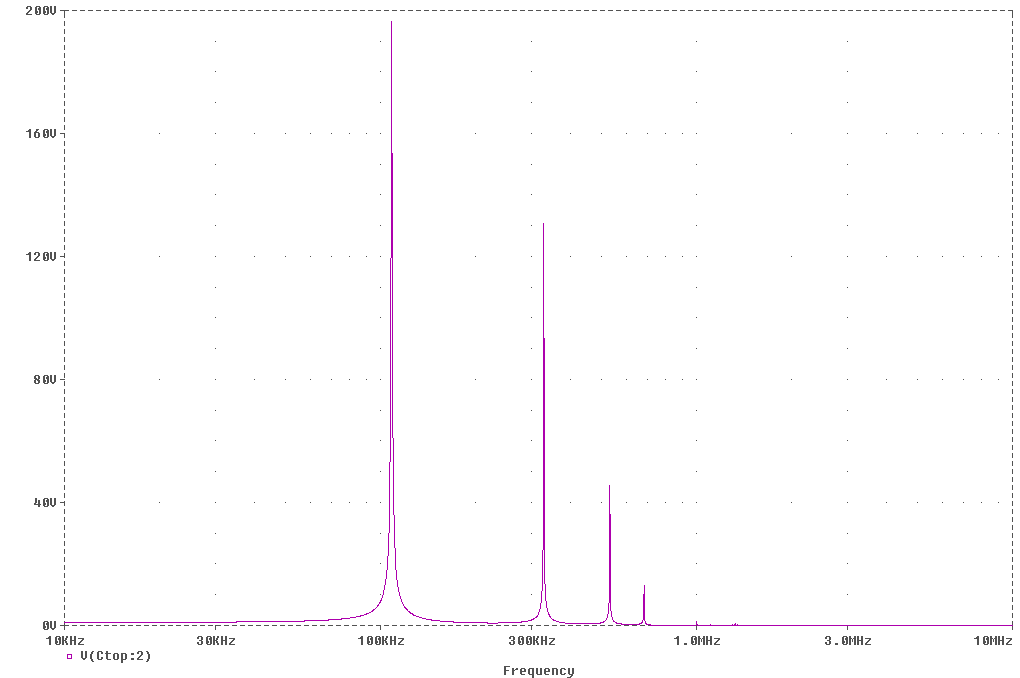
This is a frequency sweep with 1 volt p-p input
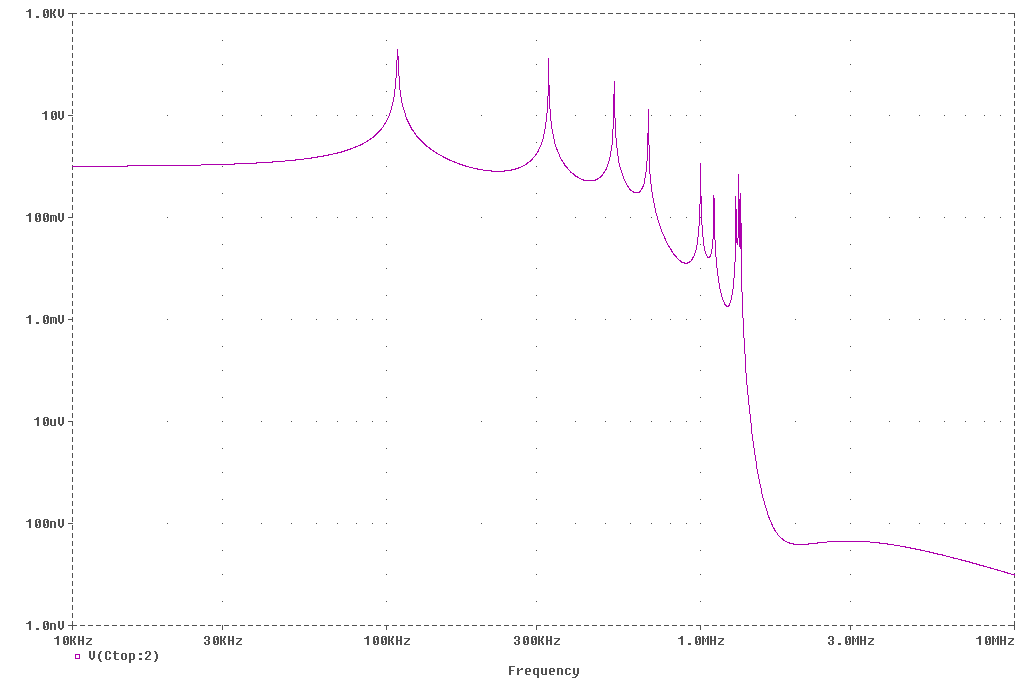
The same sweep on a log scale
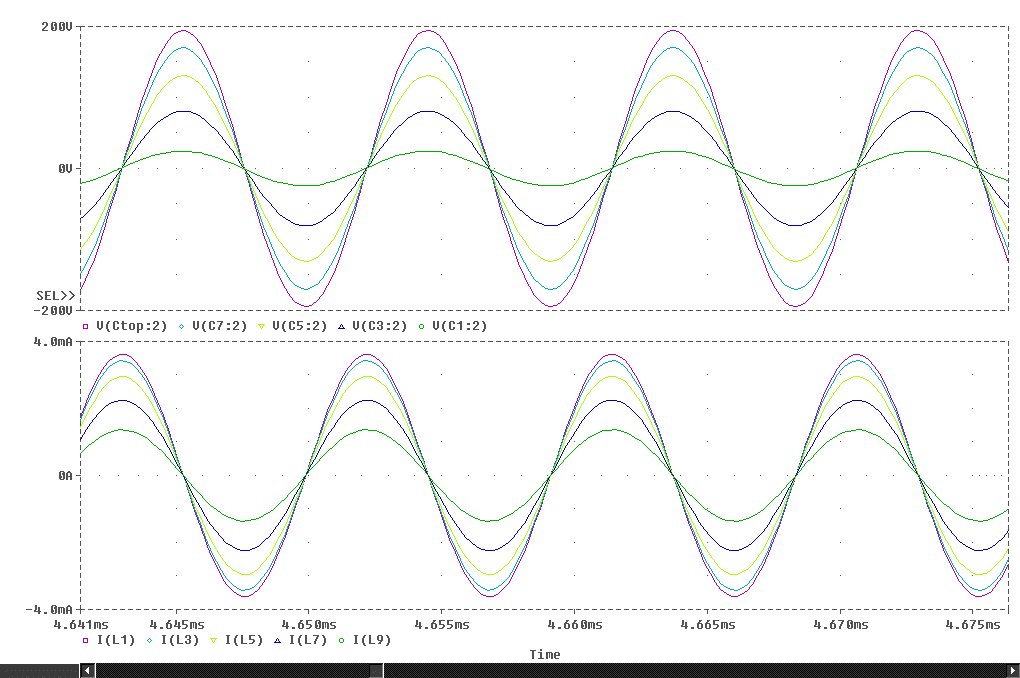
These are the voltage and current waveforms along the coil. Not that everything is in phase along the coil!! This matches what I measure in that the top and bottom currents are in phase but the current is lower at the top.
This is a chart of the voltages and
currents along with the plot
| Test Point | Voltage | Current (mA) |
| Top | 194.6 | 1.359 |
| L7 | 169.9 | 2.244 |
| L5 | 130.6 | 2.950 |
| L3 | 80.8 | 3.419 |
| L1 | 24.5 | 3.613 |
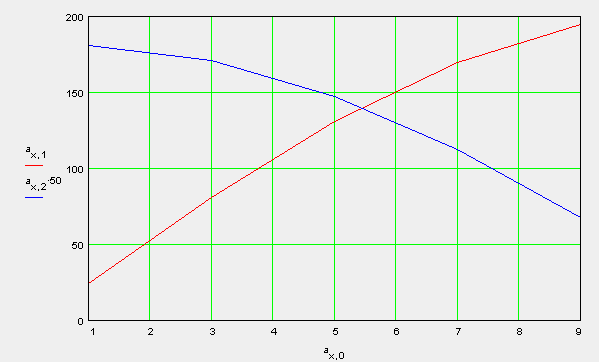
This is a model of the voltage distribution using a simple sine function
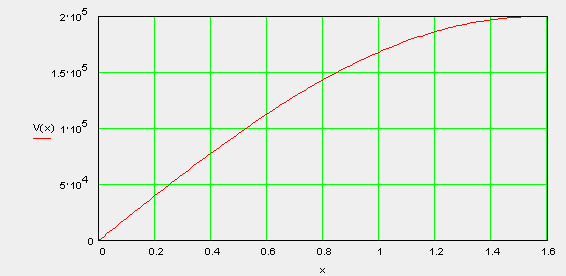
![]()
This is the current using a cosine function with a multiplication factor
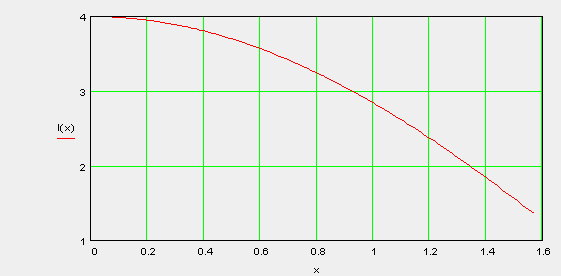
![]()
a:=0.78
This function seems to match the model well and simulates the current seen at the top of the coil.