A Method of Directly Measuring the Secondary Inductor Voltage Profile of Tesla Coils
Terry Fritz
November 15, 2000
Introduction:
The voltage profile along a Tesla coil's secondary inductor has been the subject of many debates. Sine, linear, and other functions have been suggested but, until now, no experimental validation has been offered. This paper describes a method to directly measure the secondary voltage of a Tesla coil and presents those results.
Description:
The author has found an instrument that will basically read off a
secondary coil's voltage profile. It does not seem to affect the secondary frequency or have any other significant affects on the coil's operation. A schematic diagram and photo of this simple instrument are shown bellow:
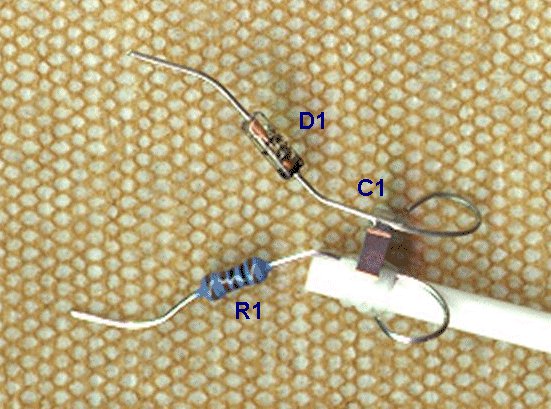
Schematic and photo of the voltage profiling instrument.
The parts of the voltage profiling instrument are as follows:
D1 - 1N34A Germanium diode to rectify the signals.
C1 - 0.1uF polypropylene 50V surface mount capacitor to store the rectified voltage level until it can be measured.
R1 - 1000 ohm 1/4 watt resistor that provides current limiting to protect the fragile D1.
The white rod is used to hold the probe in place.
Operation:
The instrument works as follows:
Tiny scratches are made in the secondary at every inch to allow direct electrical access to the windings. These scratches match up to the two probe tips on the instrument that are spaced at exactly one inch. When the instrument is placed against the secondary coil, direct electrical contact is made and the capacitor C1 is charged to the peak voltage across that 1 inch section of coil minus the diode voltage drop. The diode voltage drop can be fairly easily mapped for different voltages and appears to be very independent of frequency (it is not very significant in many cases). In this case, it was 0.10 volts at 86.7kHz and 0.14 volts at 146kHz. The tiny instrument appears to be quite invisible to the large secondary especially once C1 is finished charging and it is no longer drawing any current.
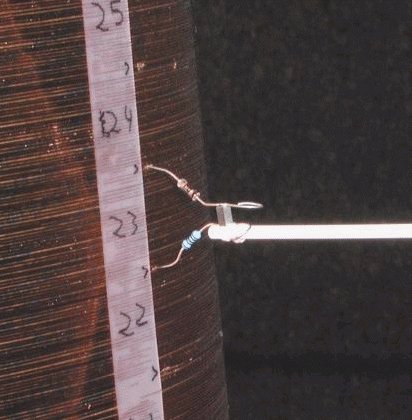
Instrument in position on secondary coil.
Once C1 is charged to the voltage of interest, the profiler can be easily drawn away and the voltage of the capacitor can be read off with a 10Meg ohm scope probe. The digital storage scope can easily "catch" the voltage of the capacitor before the scope probe has a chance to drain it significantly. The tiny polypropylene cap has very low leakage and can retain a voltage accurately for several minutes as long as the instrument is kept clean (washing with alcohol insures this).
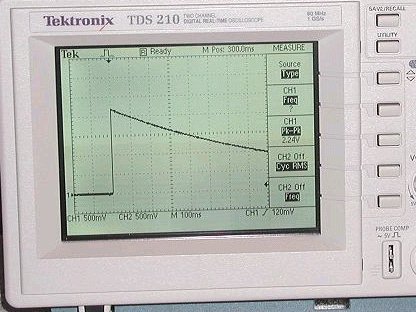
Typical voltage captured on digital scope.
Voltage measurements can thus be taken along the length of the coil at every inch. A simple summation of these voltages along the coil will give the voltage profile.
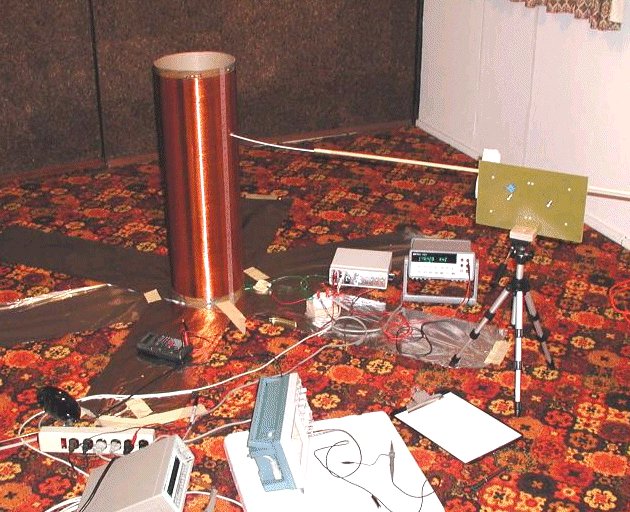
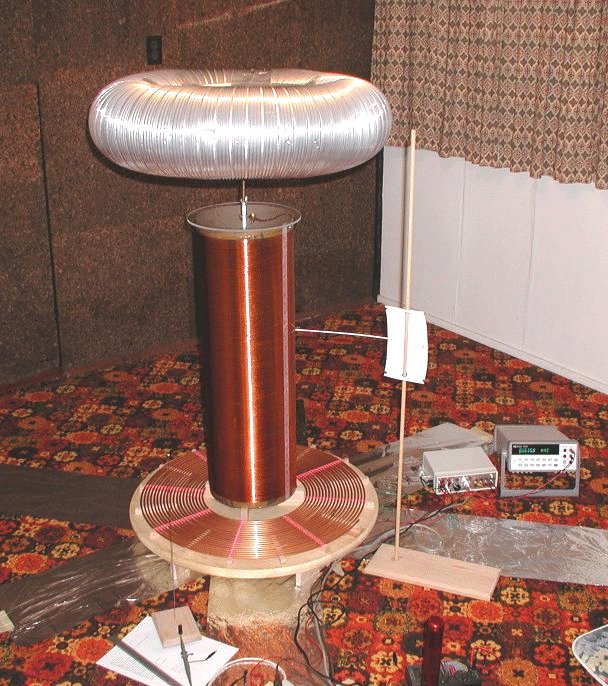
Bare and top loaded coil measurements.
Experiment:
One inch sections of the coil were numbered 1,2,...30 with the base section being 1. The secondary was scratched at every inch to gain electrical contact. The instrument was held by a stand. It was positioned, given a moment, and then the probe was pulled away and the reading taken.
The probe was tested in the forward and reverse directions and the readings were the same. A single section was re-tested three times and the reading were extremely consistent.
The continuity was checked with a voltmeter when the probe was placed to insure that the delicate contact was made. The capacitor was then shorted to insure it was at zero voltage before the measurement.
For the bare coil case, the coil was driven by a <1 ohm signal generator but a 49.8 ohm surface mount resistor was put inline for current sensing. Thus, the generator had a 50 ohm impedance.
The Fo frequency was 146.45 kHz. The voltage drop across the resistor was 46.5mVACrms. The generator outputs 0.7071 VACrms, or 1 volt peak, or 2 volts P-P. It is a MAX038 chip device. The multimeter is an HP34401. The scope is a Tektronix B210.
From the above, The input voltage was 0.6606 VACrms at 0.9337mA at 146.45kHz.
Reading the voltage of the capacitor with the digital storage scope was easy. It was consistent and very accurate. At these low voltages, the cap should have not drifted at all.
Results:
Below are the tabulated results of testing a 10.25 inch diameter, 30 inch long 1000 turn bare coil with the instrument. The bare coil sat 1 inch above the foil ground plane as shown. The Q of the bare coil was 73.3.
Section Measured Voltage + Running
Number Voltage Diode Drop (0.10) Sum
0 0 0 0
1 1.48 1.58 1.58
2 2 2.1 3.68
3 2.38 2.48 6.16
4 2.54 2.64 8.8
5 2.76 2.86 11.66
6 2.7 2.8 14.46
7 3 3.1 17.56
8 2.8 2.9 20.46
9 3.02 3.12 23.58
10 2.92 3.02 26.6
11 2.88 2.98 29.58
12 2.84 2.94 32.52
13 2.8 2.9 35.42
14 2.72 2.82 38.24
15 2.74 2.84 41.08
16 2.66 2.76 43.84
17 2.4 2.5 46.34
18 2.4 2.5 48.84
19 2.3 2.4 51.24
20 2.24 2.34 53.58
21 2.12 2.22 55.8
22 1.98 2.08 57.88
23 1.78 1.88 59.76
24 1.7 1.8 61.56
25 1.64 1.74 63.3
26 1.42 1.52 64.82
27 1.32 1.42 66.24
28 1.06 1.16 67.4
29 0.92 1.02 68.42
30 0.6 0.7 69.12
The fully terminated coil system test was performed with the following setup.
Ceiling Distance = 84 Wall Distance = 60
Primary Height (Inner Turn) = 4 Primary Inner Diameter = 12
Primary Outer Diameter = 26 Primary Height (Outer Turn) = 4
Secondary Base Height = 6 Secondary Diameter = 10.25
Secondary Length = 30 Secondary Inductance (mH) = 75.4
Terminal Height (center) = 50 Terminal Cord Diameter = 8
Terminal C-C Diameter = 22
The signal generator was changed to a <1 ohm output impedance for the terminated coil test. Thus the input signal was a 0.707VACrms sine wave. The frequency was 86.70kHz. This coil system had a measured Q of 163.6.
Section Measured Voltage + Running
Number Voltage Diode Drop (0.10) Sum
0 0 0 0
1 3.68 3.78 3.78
2 4.48 4.58 8.36
3 4.96 5.06 13.42
4 5.2 5.3 18.72
5 5.44 5.54 24.26
6 5.16 5.26 29.52
7 6 6.1 35.62
8 5.44 5.54 41.16
9 5.76 5.86 47.02
10 5.44 5.54 52.56
11 5.72 5.82 58.38
12 5.56 5.66 64.04
13 5.84 5.94 69.98
14 5.56 5.66 75.64
15 5.72 5.82 81.46
16 5.76 5.86 87.32
17 5.32 5.42 92.74
18 5.4 5.5 98.24
19 5.4 5.5 103.74
20 5.48 5.58 109.32
21 5.2 5.3 114.62
22 5.24 5.34 119.96
23 5 5.1 125.06
24 5.04 5.14 130.2
25 4.8 4.9 135.1
26 4.72 4.82 139.92
27 4.16 4.26 144.18
28 3.96 4.06 148.24
29 3.68 3.78 152.02
30 2.64 2.74 154.76
Graphs of the secondary profiles for both cases follow. Equations were matched to these profiles for computational purposes.

Normalized Bare Coil Voltage Profile.
This graph closely follows the equation v = x + 0.65 x^2 - 0.64 x^3
Normalized Terminated Coil Voltage Profile.
This graph closely follows the equation v = 0.95 x + 0.35 x^2 - 0.29 x^3
Conclusion:
The secondary voltage profiling instrument presented provides a solid reliable method of measuring the voltage profile of secondary coils. This data is very useful for various Tesla coil modeling efforts as well as answering the long standing debate about what shape the voltage profile actually does take.
Acknowledgments:
Many thanks to Paul Nicholson and the members of his TSSP list for their great efforts in modeling secondary coil behavior by computer. It was trying to supply this project with real data that inspired this work.