This paper discusses the authors research into the electrical characteristics of Tesla coil primary circuits. A high-bandwidth fiber-optic probe system was used to measure and record waveforms in a typical primary system. A number of new mechanisms have been found which influence the coils behavior. These are summarized below:
Introduction:
The author has developed a fiber-optic voltage and current probe system for the analysis of Tesla coil operation. During the development of this system, a number of interesting phenomena were found when the voltages and currents in the primary circuit were examined at very high bandwidth. It is felt that these phenomena are very significant and that they can explain much more about the primary circuits operation than was previously known. All the testing presented here was done without the secondary system in place and at relatively low power levels. However, the results given are believed to represent all spark gap RLC systems.
Test Setup:
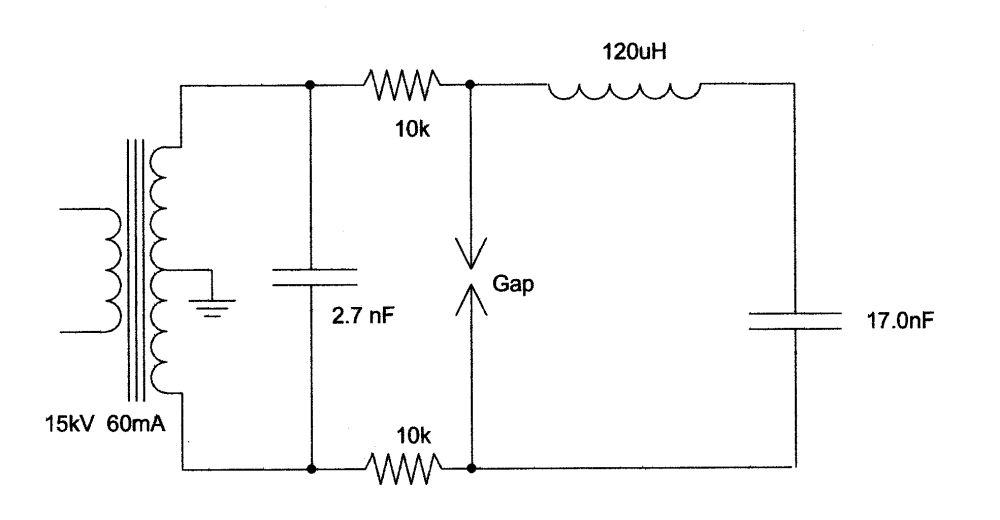
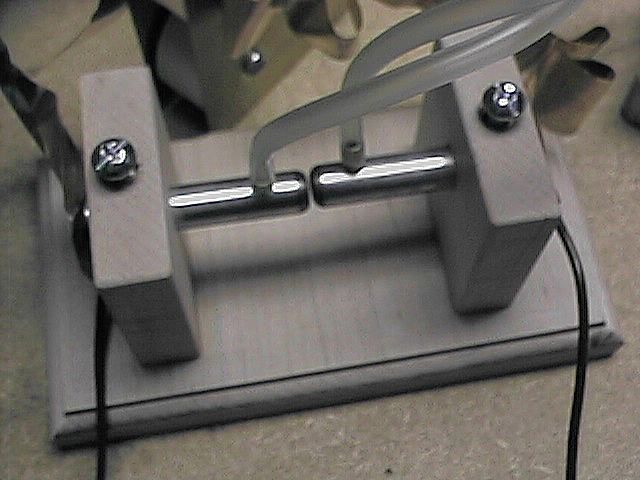
A schematic diagram of the test system is shown below. A common variac with typical line filtering components powers a 15kV 60mA neon sign transformer. The transformer is connected to the primary circuit through a simple RC-filter. The isolated differential voltage can be measured between any two points and can be recorded on a digital oscilloscope for analysis. The current can be measured with a selected current shunt through any line in the system. All the measurements are isolated by the fiber-optic system. The bandwidth, noise immunity, square wave response, and level accuracy are believed to be more than adequate to make the measurements presented here. The measurement system has two channels that can be monitored at either 2.5Mhz or 40MHz bandwidth. The 2.5MHz output allows for much more accurate level measurements while the 40MHz output will allow for high bandwidth at reduced level accuracy. The primary capacitor is composed of ten TDK 4001 series "doorknob" capacitors connected in parallel between two brass plates. The total capacitance is 17.0nF. The primary inductor is a 120mH linear coil of 1/4 in copper tubing on a wood frame. The spark gap is a simple gap between two 1/2-inch steel rods with air pumped into the gap through small holes. Pictures of the setup and the individual components are shown bellow:
System schematic
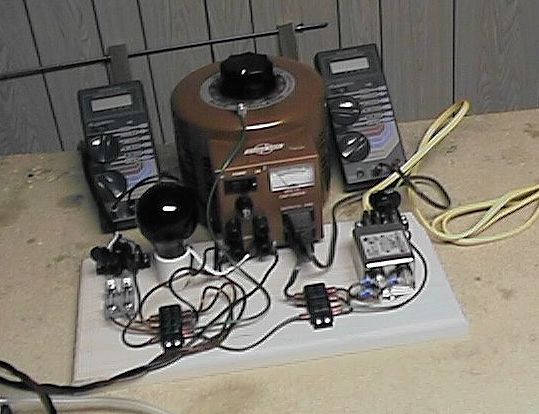
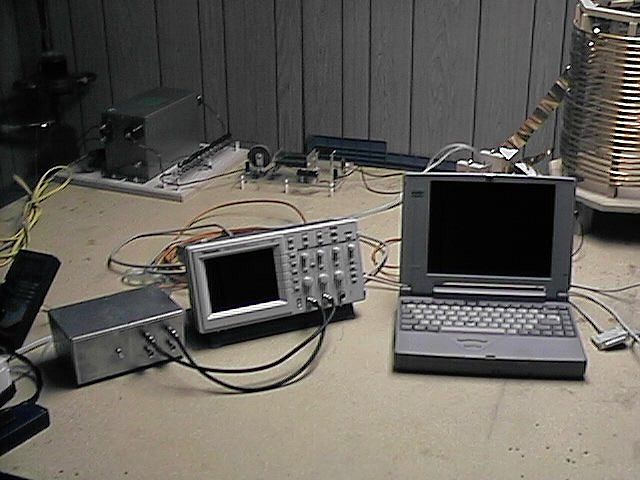
Variac and control system
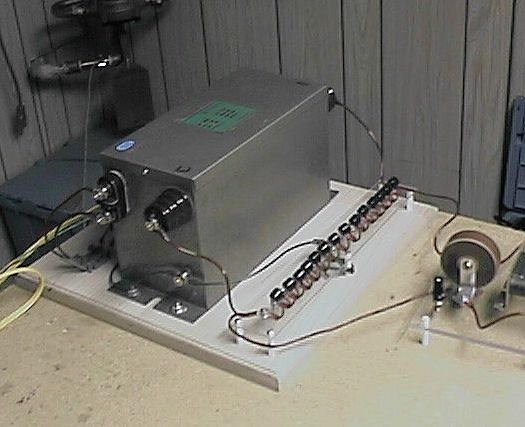
Neon and filter system
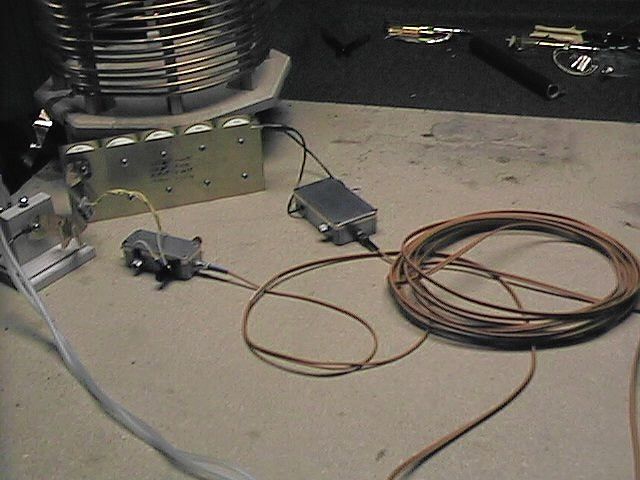

Fiber system
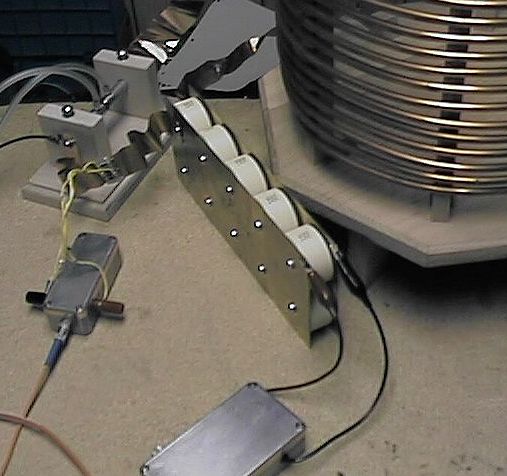
Primary capacitor 17.0nF
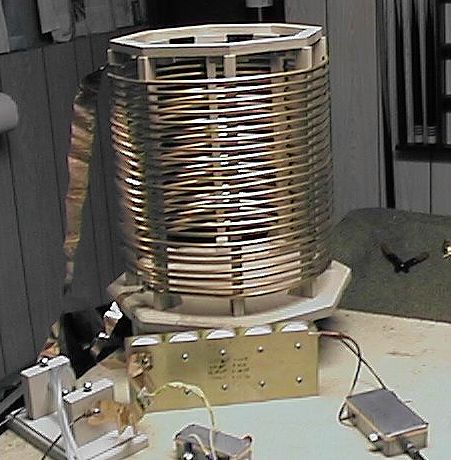
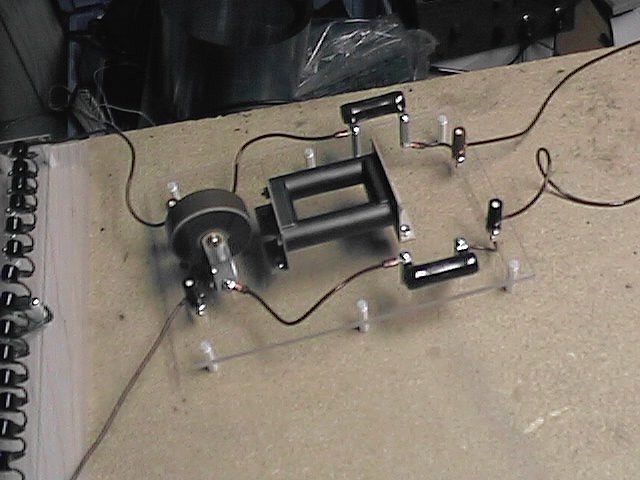
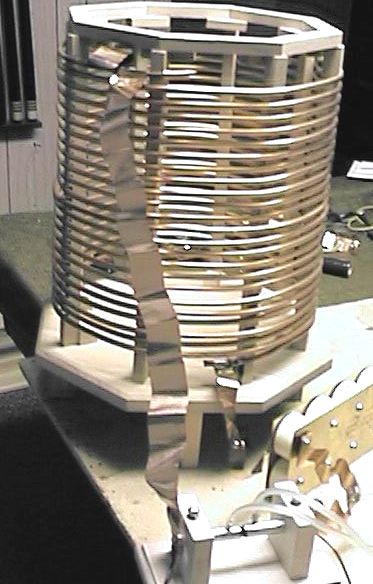
Primary inductor 120uH
Spark gap
The Instant before the Gap Fires:
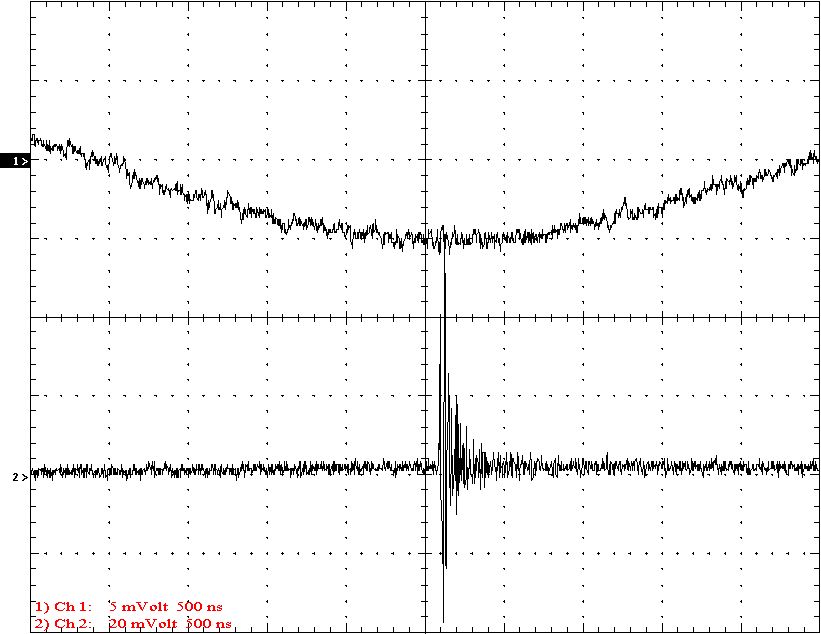
The two oscilloscope photos below show the voltage (top trace) and current (bottom trace) waveforms across the spark gap during the initial gap firing. In the second picture it can be seen that the voltage becomes unstable about 50nS before the initial current spike begins. This is probably a result of ionization within the gap. This behavior is fairly consistent from test to test. It is interesting to note that the voltage seems to rise higher than the charging voltage.
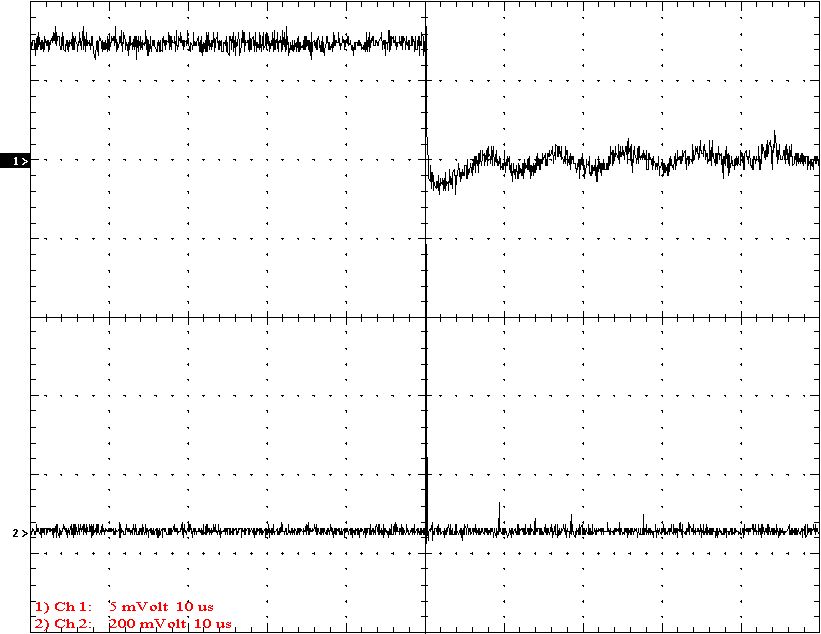
Voltage and current across the spark gap at the initial gap firing.
Top trace Voltage ~2500v/div 40MHz bandwidth
Bottom trace Current ~2500A/div 40MHz bandwidth
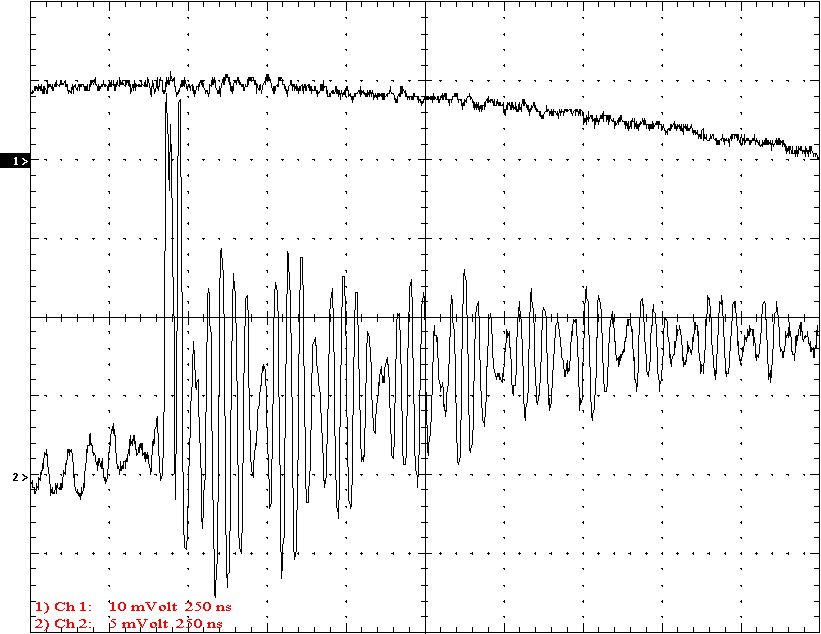
The Initial Current Spike:
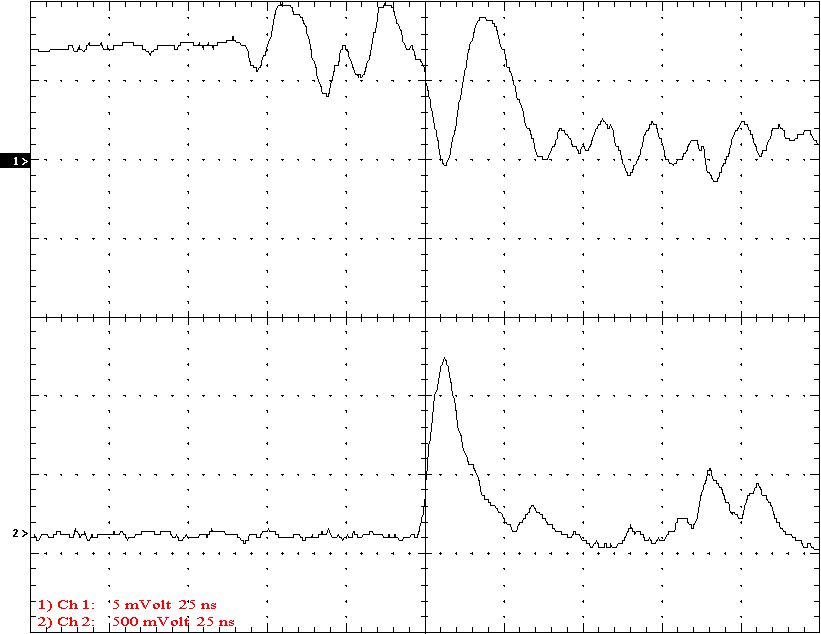
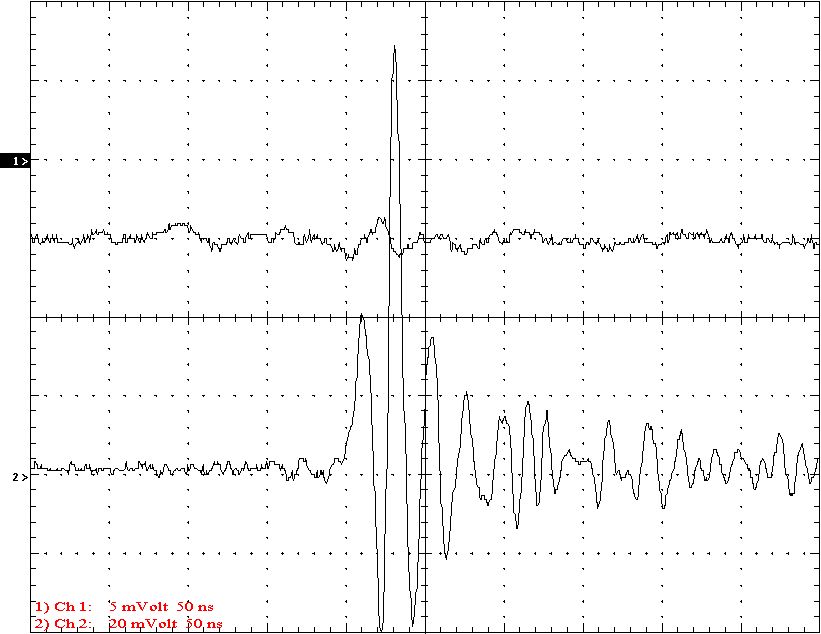
The waveforms below show the initial current spike. The peak amplitude appears to be around 4500 amperes. The width is ~20nS. Heavy ringing always follows this pulse. There appears to be a 1MHz fundamental that quickly dies out with a 50MHz ring that lasts about 500nS.
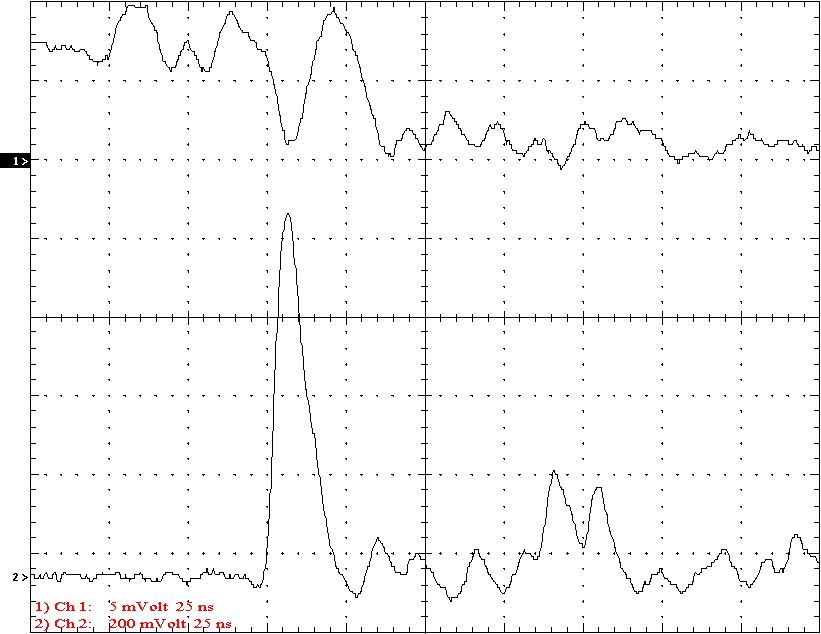
Voltage and current across the spark gap at the initial gap firing.
Top trace Voltage ~2500v/div 40MHz bandwidth
Bottom trace Current ~1000A/div 40MHz bandwidth
Current Bursts:
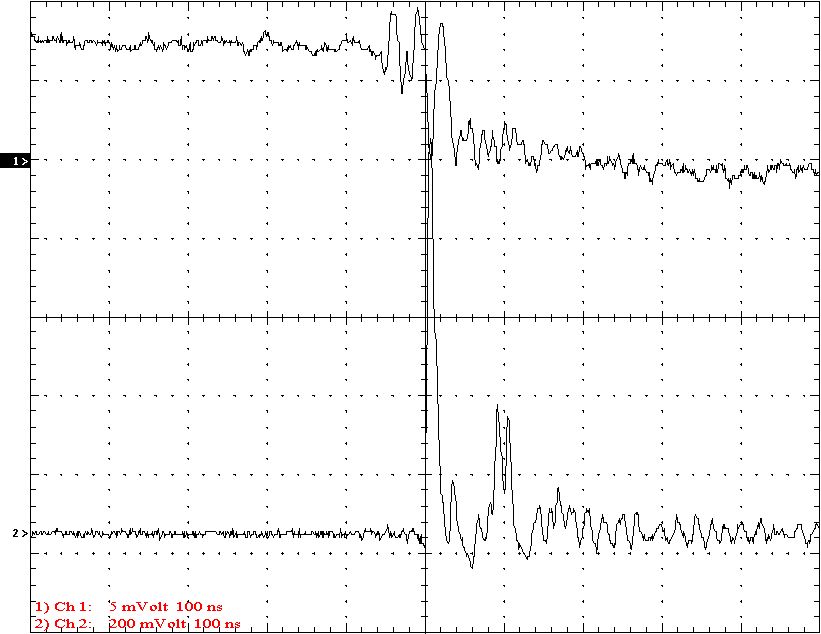
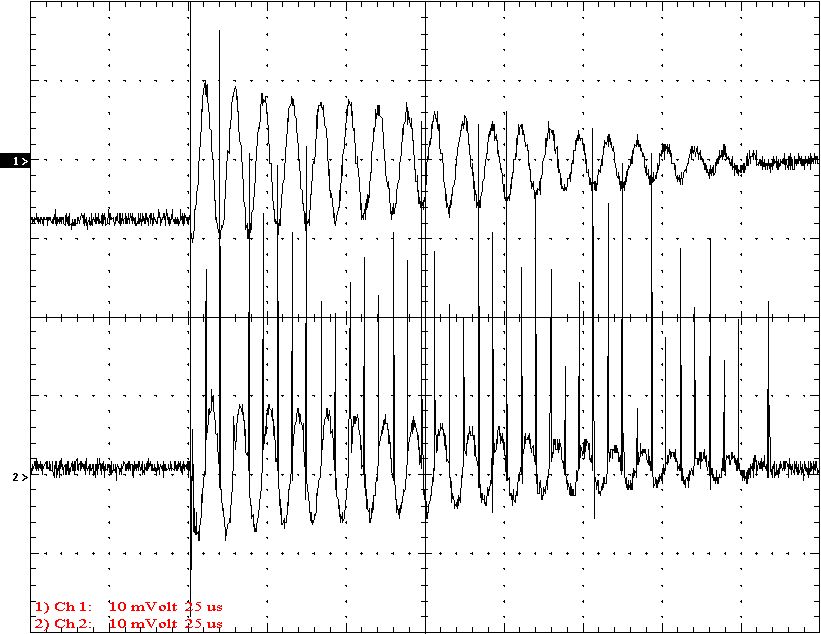
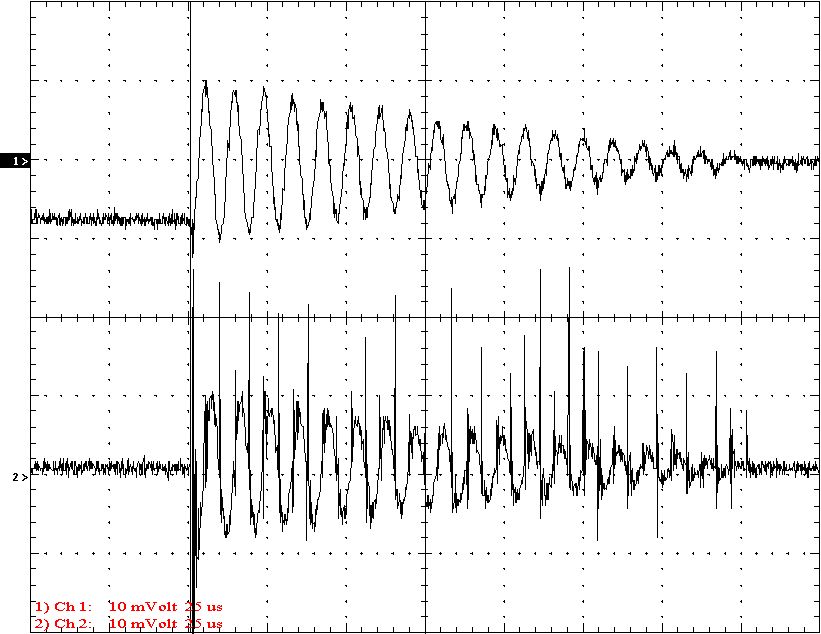
Probably the most surprising result found in this testing is that the current waveform in the primary circuit has a series of powerful current bursts that occur at the peaks of the voltage waveform (also the zero current crossing points). The following six photos show these spikes at different horizontal time rates.
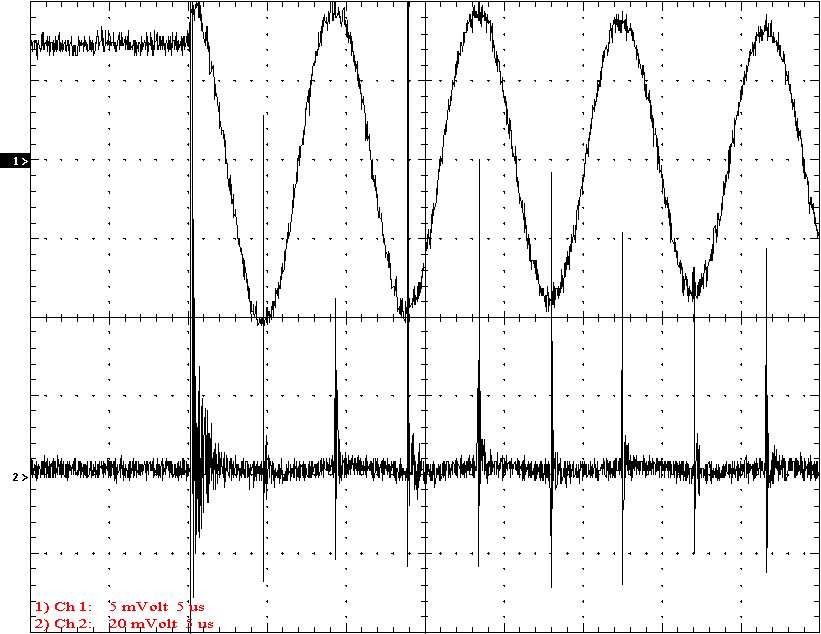
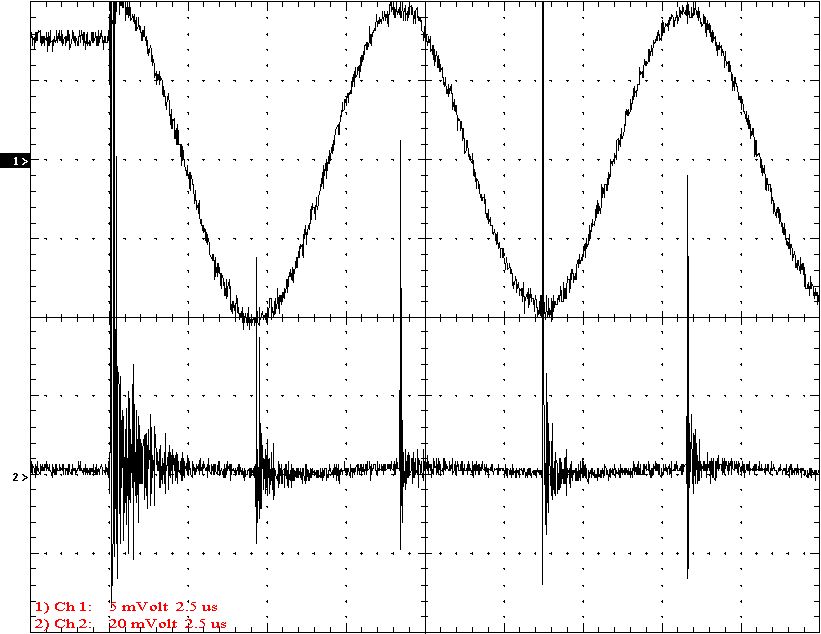
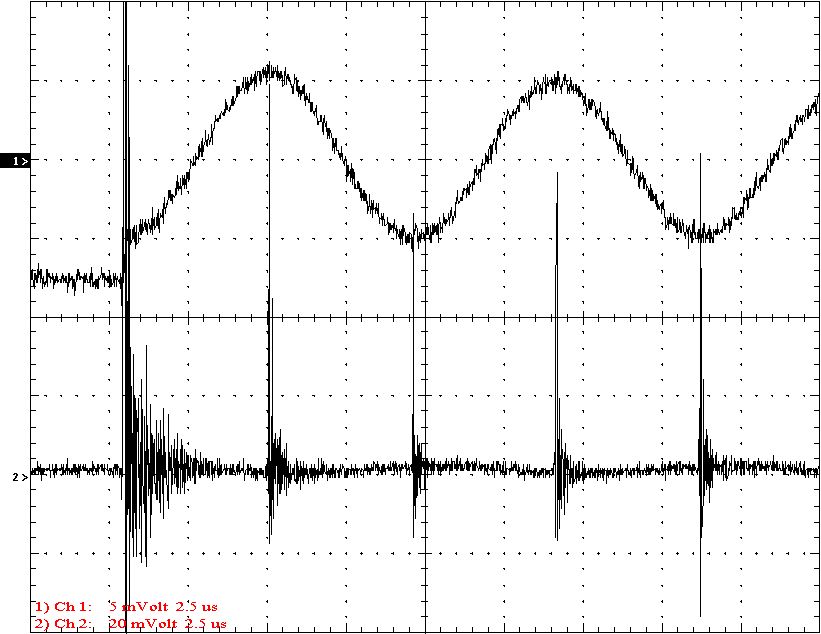
Voltage and current across the primary capacitor during the firing cycle.
Top trace Voltage ~2500v/div 40MHz bandwidth
Bottom trace Current ~100A/div 40MHz bandwidth
These current bursts seem to coincide with the zero current crossing point as the current passes through the zero level. It is believed that the arc actually stops at this point and re-ignites a few hundred nanoseconds later. This requires that both the voltage across the gap and current through the gap need to reach a certain minimum level before the gap begins to conduct again.
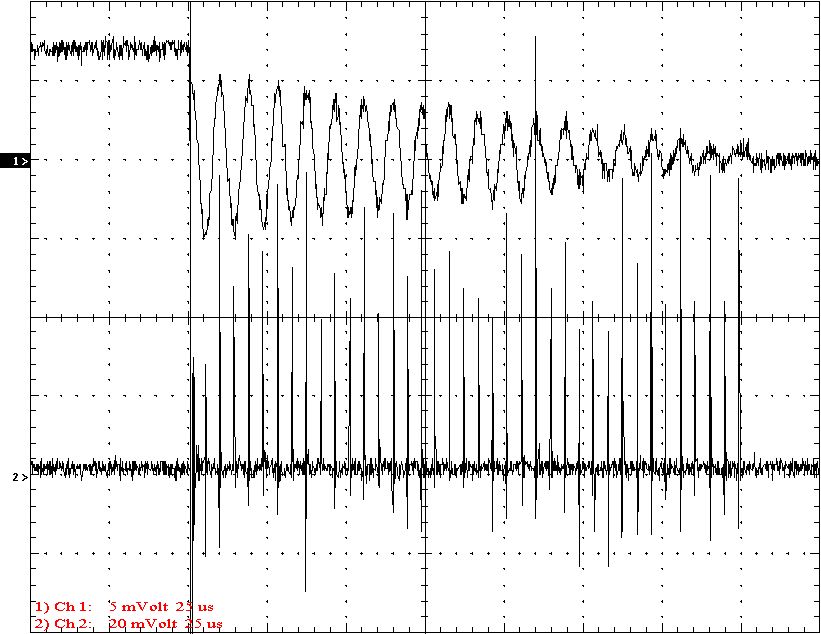
The following photo uses digital averaging to help clarify the energy of the bursts. The bandwidth is reduced to 2.5MHz. It appears that the bursts stay at a fairly consistent level despite the loss of total energy in the system. This picture suggests that the energy loss during the burst is fairly constant. This constant energy loss is probably responsible for the linear decrement waveform. Seen on LC spark gap systems
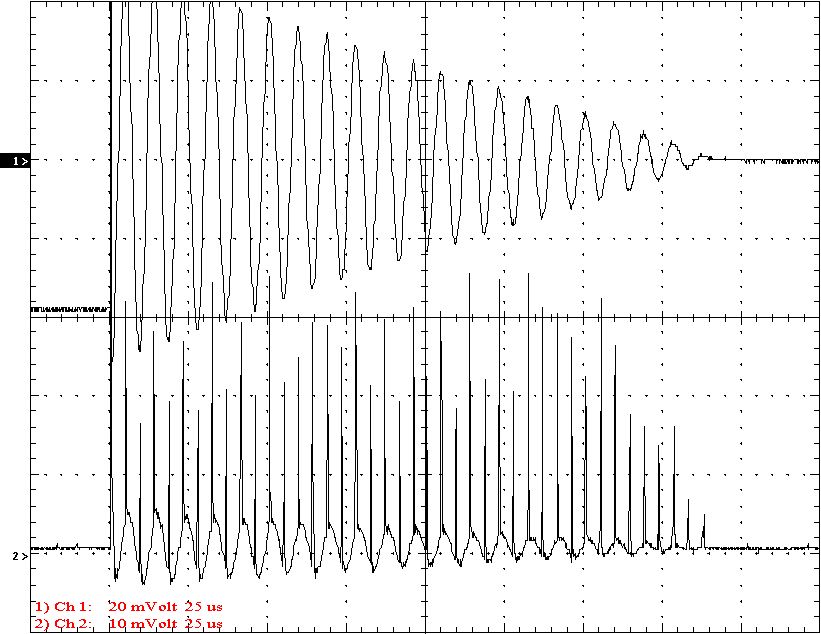
Voltage and current across the primary capacitor during the firing cycle.
Top trace Voltage 2000v/div 2.5MHz bandwidth 16 sample average
Bottom trace Current 100A/div 2.5MHz bandwidth 16 sample average
Affects of Poor Primary Wiring:
It is well known that wiring in the primary circuit that is not well suited to high frequency currents reduces the efficiency of Tesla coils. It formerly has not been clear why this is so given the relatively low operating frequency of Tesla coils. The following four pictures show the primary waveforms with first "good" RF wiring and the with "bad" RF wiring.

Voltage (top) and current (bottom) waveforms with "good" RF wiring.
Voltage (top) and current (bottom) waveforms with "bad" RF wiring.
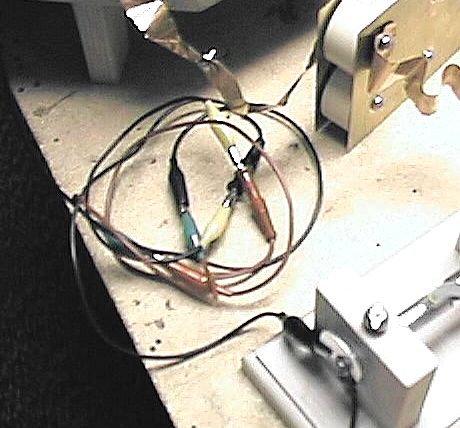
"good" wire. A thick copper strap. "bad" wire. A string of alligator leads.
A New Model of the Primary System:
From the testing that has been done to date, a new model of spark gap operation is suggested. The schematic diagram below represents a system, which the author believes can basically explain the actual results seen.
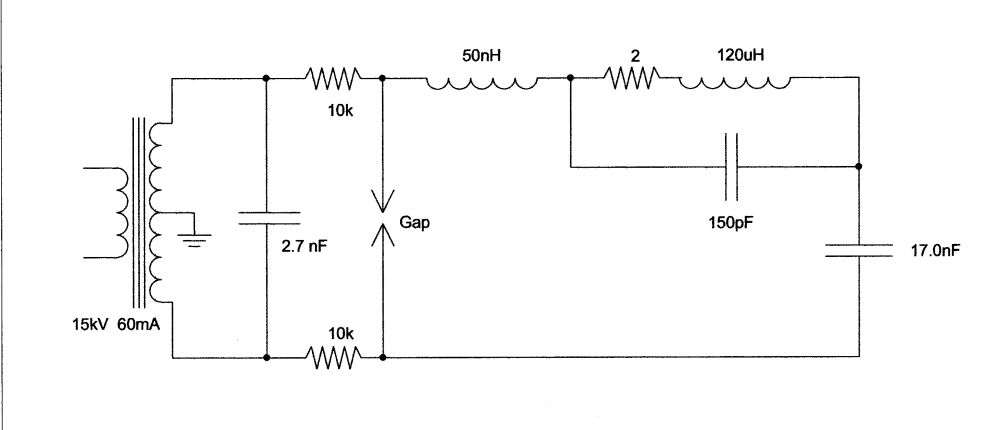
In this model the 50nH inductor represents the lead wiring. This inductance is believed to resonate with the primary capacitor to produce the high frequency (~50MHz) ringing associated with the current bursts. The 150pF capacitor represents the self inductance of the primary inductor. This value was found by finding the resonant frequency of the inductor by itself in the same way one finds the resonant frequency of a secondary inductor. In this case, the self resonant frequency was found to be 1.2MHz. The 2 ohm resistor represents the resistance of the primary inductor at the high (~50MHz) frequency. The theory of the primary circuits operation is as follows:
This model suggests that a significant amount of energy is being lost in the primary inductor and the lead wiring during these high frequency bursts. The resistance of the system is much higher at 1.2MHz and becomes very high at 50MHz. This suggests three ways energy is lost in the system.
The author has done some work using spice and has found that modeling can reproduce these effects. However, more work is needed to further define the model.