Experiment: expt7Status at Fri May 17 13:31:19 MDT 2002 |
First data: 2002/05/05 17:52 Latest data: 2002/05/06 17:06 Total records: 196 Last file processed: TE000392
|
| Weather |
| Temperature | Humidity | Pressure |
|---|---|---|
| Mean: 17.30 degC | Mean: 33.02 percent | Mean: 844.19 mB |
| Std Dev: 9.09 degC | Std Dev: 16.96 percent | Std Dev: 1.13 mB |
| Current: 25.30 degC | Current: 16.34 percent | Current: 842.48 mB |
| Signals |
| F1 | F3 | F5 |
|---|---|---|
| Mean frequency: 351.365 kHz | Mean frequency: 869.771 kHz | Mean frequency: 1263.771 kHz |
| Mean Q-factor: 198.48 | Mean Q-factor: 158.66 | Mean Q-factor: 154.39 |
| Mean Level: -0.4 dB | Mean Level: -13.1 dB | Mean Level: -19.1 dB |
Overall signal quality: 98.25 percent
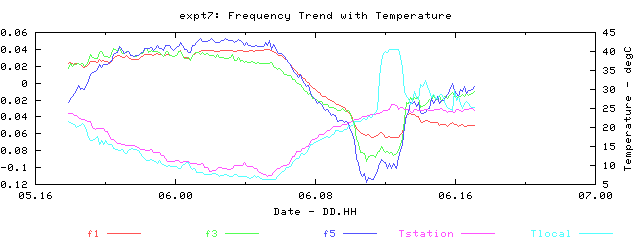
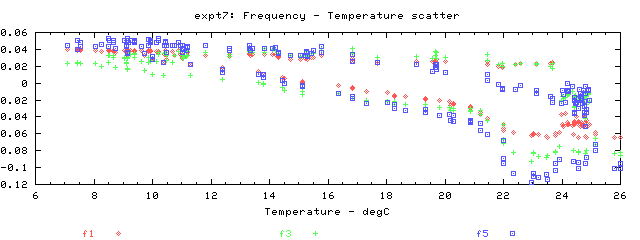
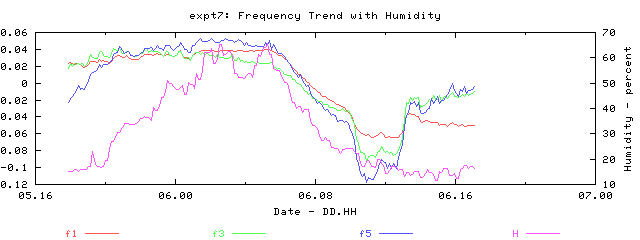
| Frequency variation with temperature |
Frequency deviation from the mean as a percentage, against temperature in deg C.
Regression slopes:
F1/T = -0.00 %/degC;
F3/T = -0.00 %/degC;
F5/T = -0.00 %/degC;
| Q-factor variation with temperature |
Q-factor deviation as a percentage of the mean, against temperature.
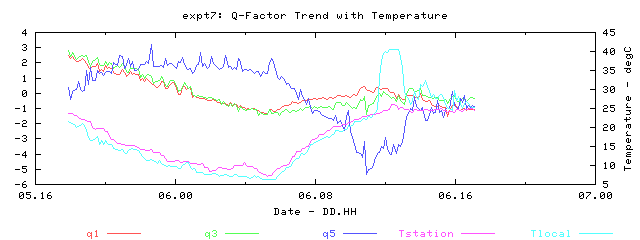
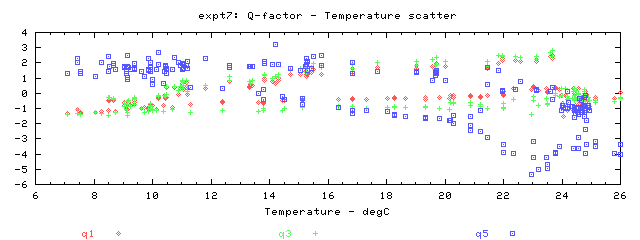
Regression slopes:
Q1/T = 0.01 %/degC;
Q3/T = 0.01 %/degC;
Q5/T = -0.17 %/degC;
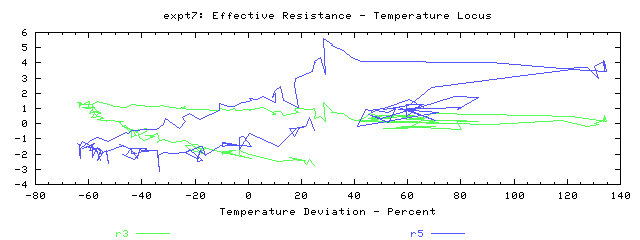
| Resistance variation with temperature |
Looking just at f3/4 and f5/4 for the underlying temperature trend, free of moisture disturbances.
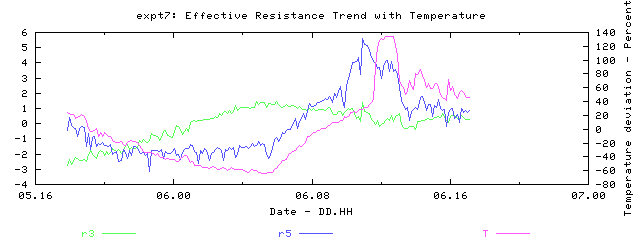
Regression slopes:
R3/T = -0.01 %/degC;
R5/T = 0.17 %/degC;
| Frequency variation with humidity |
Frequency deviation as a percentage of the mean, against percentage humidity.
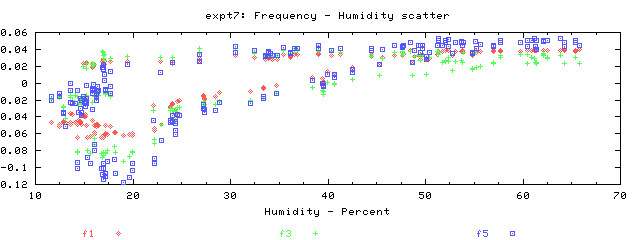
Regression slopes:
F1/H = 0.00 %/%;
F3/H = 0.00 %/%;
F5/H = 0.00 %/%;
| Q-factor variation with humidity |
Q-factor deviation as a percentage of the mean, against percentage humidity.
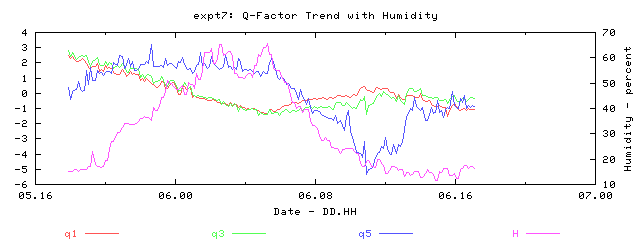
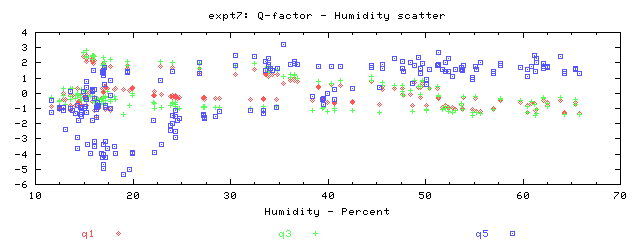
Regression slopes:
Q1/H = -0.02 %/%;
Q3/H = -0.02 %/%;
Q5/H = 0.08 %/%;